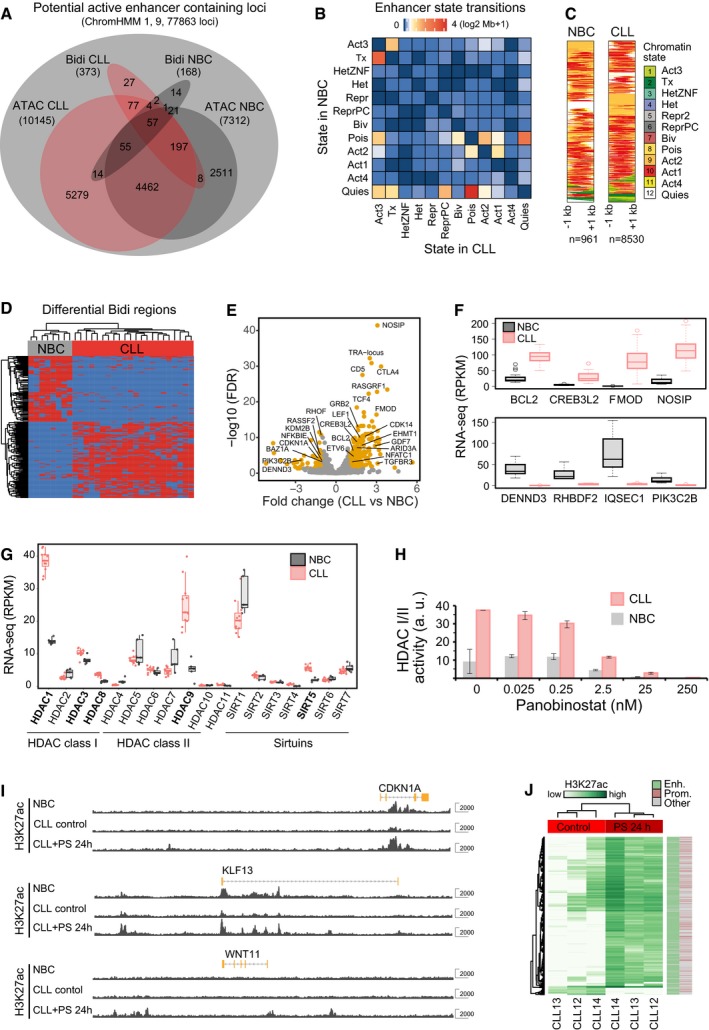
Overlap of active regions identified in CLL and NBCs by ChromHMM, ATAC peaks, or bidirectionally expressed RNA loci labeled as “Bidi”. Venn diagram showing the total number of overlapping regions (not area‐proportional).
Chromatin transitions within differential active states between NBC and CLL. Heatmap representation of the amount of chromatin (log2 Mb + 1) transitioning from a particular state in NBC (rows) to CLL (columns). Transitions were considered for all recurrent active chromatin state regions (states 1, 8, 9, and 11) present in a minimum of three samples even if the consensus state was not an active state. Accordingly, the matrix includes transitions between non‐active states at low frequencies.
Chromatin states at bidirectionally transcribed predicted enhancers loci. All Bidi loci identified in NBC samples (n = 961) and CLL samples (n = 8,530) are shown. The Bidi loci show an enrichment of the states “Active 2 (predicted active enhancer)” and “Active 1 (predicted transcription start sites)”.
Clustering of samples via expression of bidirectionally regions that are differential between NBCs and CLL and quantified using DESeq2.
Volcano plot of differential super‐enhancers targeting known leukemia and cancer genes. Examples include SE loss at CDKN1A, PI3KC2B, and KMT2B (MLL2) and SE gain at FMOD, CREB3L2, CTLA4, TCF4, LEF1, and BCL2. Points represent non‐differential SEs (gray) and differential SEs (FDR < 0.01) with fold change > 1 (orange).
RNA expression changes of selected genes associated with differential SEs. Top: genes significantly (FDR < 0.05) upregulated by SEs in CLL. Bottom: genes significantly downregulated by SEs in CLL. In the boxplot, maximum, third quartile, median, first quartile and minimum are indicated. The number of replicates analyzed was 19 (CLL) and 7 (NBC), respectively.
Comparison of normalized gene expression of histone deacetylases between CLL and NBCs. Histone deacetylases significantly upregulated in CLL are shown in bold. The boxplot representation and number of samples was the same as in panel (F).
HDAC activity and its inhibition by panobinostat in B cells from CLL patients (red) in comparison with healthy donors (gray). Error bars indicate standard deviation measured in four biological replicates.
Genome browser view of H3K27ac tracks (in gray) at exemplary genes for NBCs and CLL cells 24 h after mock and after panobinostat treatment. At genes such as CDKN1A (cell cycle control) and KLF13, reduced H3K27ac signal in CLL was increased upon HDAC inhibition to the level found in NBCs. WNT11 is shown as an example of a de novo gain of an active enhancer due to treatment with panobinostat.
Heatmap displaying changes in H3K27ac read occupancy in CLL upon panobinostat treatment for 24 h. A general gain of H3K27ac in enhancers upon panobinostat treatment was observed.

