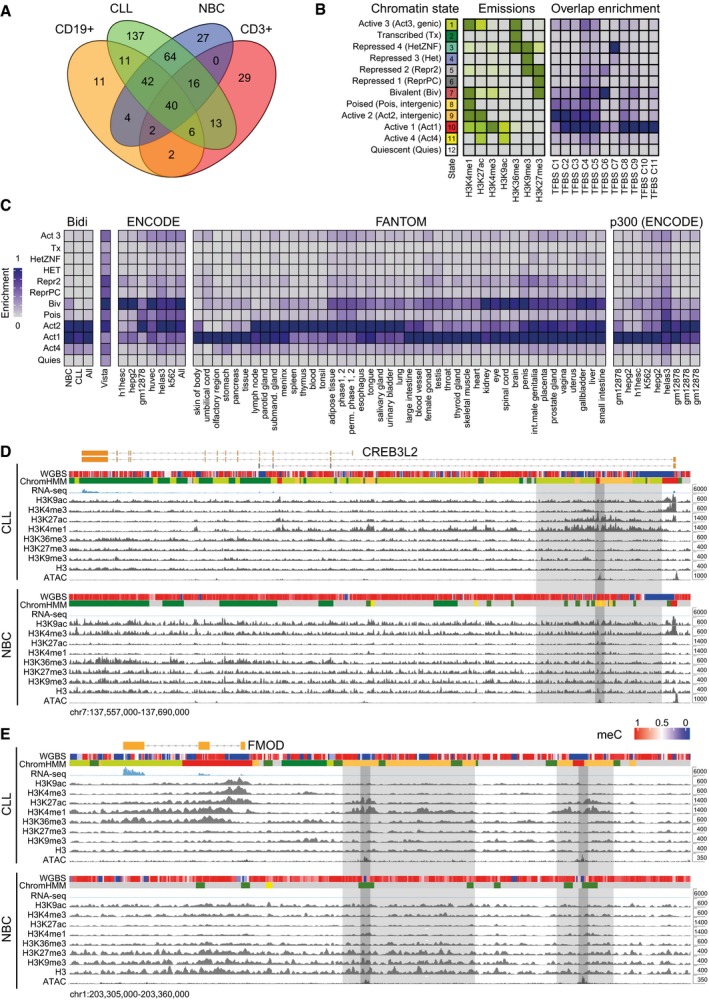
Figure EV4. Comparison of enhancers identified with previous data sets and exemplary loci.

- Overlap of CLL and NBC annotated active chromatin states (1, 8, 9, and 11) identified here with previous data sets. Venn diagram showing the total chromatin (Mb) of recurrent predicted enhancer chromatin state, occurring in at least three samples, compared to published corresponding states E7–11 of peripheral blood CD19+ B cells and CD3+ T cells from the Roadmap Epigenome project. In our union set of enhancers, 89% of known B‐cell and 71% of known T‐cell chromatin annotated as predicted enhancers were present.
- Enrichment of ENCODE TF binding sites (TFBS) in chromatin states. The average profile is shown for each cluster of TFBSs (TFBS C1–C2) with the TFBS description given in Appendix Table S5.
- Enrichment of bidirectionally expressed RNA from all samples and chromatin states changed in CLL in comparison with published data sets. These included the enhancer catalogs from Vista, modifications from ENCODE, bidirectional RNA from FANTOM, and p300 sites from ENCODE. The majority of known enhancers from diverse tissues corresponded to our active 1–3 states. Inactivation of these states in CLL occurred mostly via the bivalent state.
- Chromatin feature maps at the CREB3L2 for a CLL patient (CLL1) and an NBC donor (H7). An intragenic predicted enhancer region downstream of the TSS that became active in CLL is highlighted. Light gray depicts active chromatin region and dark gray the confined enhancer locus coinciding with an open chromatin region. For color coding of ChromHMM states, see panel (B).
- Same for the FMOD locus with two predicted enhancer regions with enhanced activity in CLL marked in gray.
