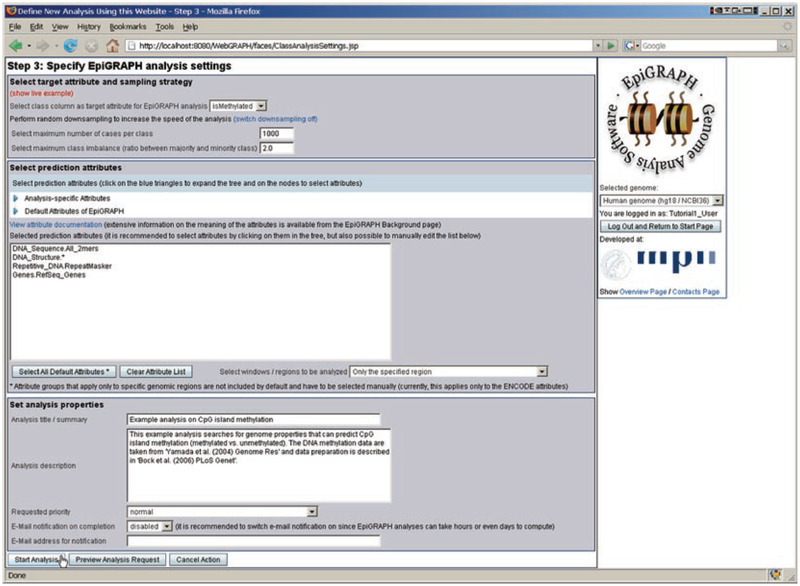
Fig. 3.
Configuring and starting an EpiGRAPH analysis. This screenshot displays EpiGRAPH’s analysis specification page. Here, the user can select which class attribute to use (if more than one class attribute was provided during the attribute submission steps), configure down-sampling, select prediction attributes, and enter a brief documentation of the analysis

