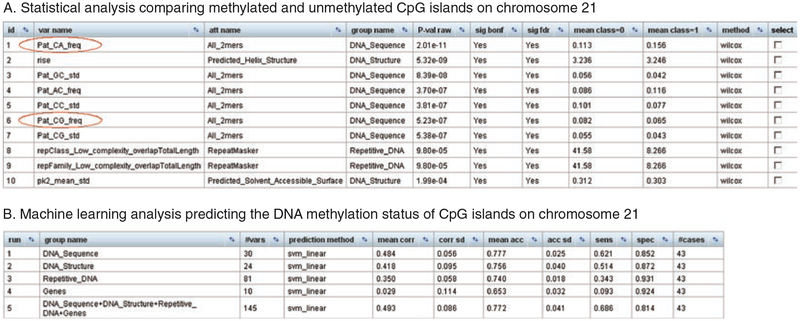
Fig. 4.
Results of an EpiGRAPH analysis of DNA methylation at CpG islands. These screenshots display the results of an EpiGRAPH analysis comparing methylated CpG islands (class = 1) with unmethylated CpG islands (class = 0), based on a published dataset of DNA methylation on chromosome 21 (31). The results of the statistical analysis (Panel A) show that the “CG” sequence pattern is over-represented in unmethylated CpG islands, while the “CA” sequence pattern is over- represented in methylated CpG islands. Statistical testing was performed using the nonparametric Wilcoxon rank-sum test and P-values were adjusted for multiple testing using the highly conservative Bonferroni method (sig bonf) as well as the false discovery rate method (sig fdr). An explanation of the attribute names is available from http://epigraph.mpi-inf.mpg.de/WebGRAPH/faces/Background.html#attributes. The machine learning analysis (Panel B) confirms that these and other differences are sufficient to predict with relatively high accuracy whether or not a CpG island is methylated. The values in the bottom table correspond to the average performance of a linear support vector machine that was trained and evaluated in ten repetitions of a tenfold cross-validation, summarized by the mean correlation (mean corr), prediction accuracy (mean acc), sensitivity (sens), and specificity (spec). Additional columns display standard deviations observed among the repeated cross-validations with random partition assignment (corr sd and acc sd), the number of attribute variables in each attribute group (#vars), and the total number of genomic regions included in the analysis (#cases)

