Figure 1.

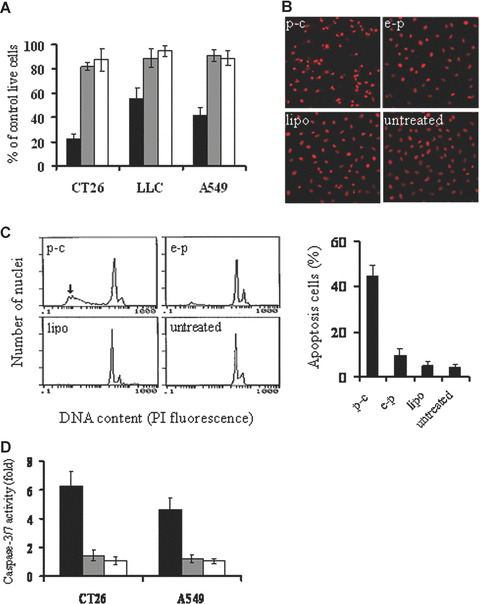
Induction of cancer cell apoptosis in vitro. (A) Viability of cancer cells by MTT assay. CT26, LLC and A549 cancer cell line were transfected with p‐c (black bars), e‐p (gray bars), or liposome alone (white bars). The transfected cells were cultured in 96‐well plates for 48–72 hrs and MTT assay was performed for observing the viability of the cells. Results are means ± S.D. of 6 wells and triplicate experiments. In each experiment, the media only treatment (untreated) represents 100% of cell viability. (B) Fluorescence‐microscopic appearance of PI‐stained nuclei in CT26 cells. Condensation of nuclear and apoptotic bodies were observed in p‐c treated group (Original magnification ×200). (C) Quantitative assessment of apoptotic cells by flow cytometry. CT26 cells were treated with p‐c or controls for 48 hrs, then cells were harvested from each group. Percentage of sub‐G1 cells (apoptotic cells) was identified by flow cytometry. Left: representative flow cytograph from three separate experiments. Arrowhead points to sub‐G1 peak in p‐c treated group. Right: Percentage of sub‐G1/apoptotic cells. Data are represented as mean ± S.D. of three independent experiments (P < 0.05). (D) Quantification of caspase‐3/7 activity in response to caspy2 treatment. CT26 and A549 cells were transfected with p‐c (black bars), e‐p (gray bars), or liposome alone (white bars). The transfected cells were cultured in 96‐well white plates for 24–48 hrs, and then the activity of caspase‐3/7 was analysed. Results are means ± S.E. of five wells and triplicate experiments, and plotted values indicate the fold increase in activity relative to untreated samples.
