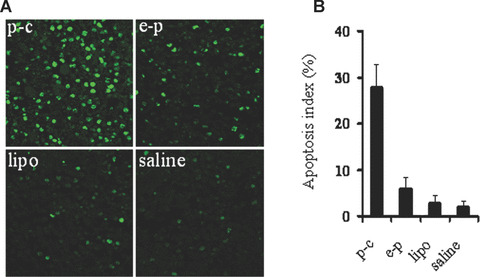
Figure 4.

TUNEL staining of tumour tissue. (A) Representative images of TUNEL staining. TUNEL staining was performed using an in situ apoptotic cell detection kit at day 14 after the beginning of treatment. Apoptotic nuclei (green) were observed under a fluorescence microscope. Tumours treated with p‐c showed apparently increase in the number of apoptotic cells within the residual tumours compared with control groups. (B) Apoptotic index. Graph shows mean values in each group, and data are presented as mean ± S.E. (P < 0.05).
