
Figure 1.
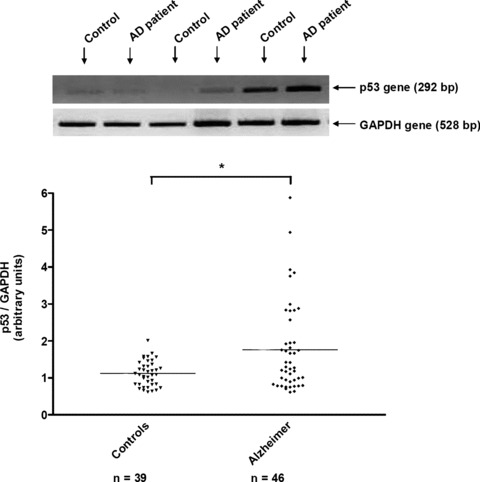
RT‐PCR analysis of p53 gene in lymphocytes of control individuals and Alzheimer patients. Representative agarose gel of p53 gene expression was shown in lymphocytes of four individuals and four Alzheimer, alternatively. The specific bands at 292 pb and 528 pb correspond to p53 and GAPDH genes, respectively. The bands were quantified by using Geldoc software. The results were expressed as arbitrary units and the line represented the mean of 39 controls and 46 Alzheimer patients. *P < 0.05 statistical difference from control individuals (Mann‐Whitney’s test). ▾ Control individuals, ♦ Alzheimer patients.