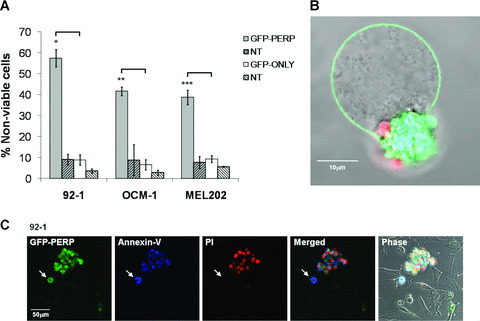
Figure 2.

Effect of PERP expression on UM cell viability. 92‐1, OCM‐1 and MEL202 cells were transiently transfected with either pGFP‐PERP or pGFP‐only and monitored by fluorescence microscopy in the presence of annexin‐V and PI. (A) The number of viable and nonviable cells in 20 fields were counted between 24 and 72 hrs after transfection, taking into account the sequential binding of annexin‐V and PI. The mean percentage of transfected (or nontransfected) cells dead in the transfected (or nontransfected) cell population, with standard deviation from three independent transfections, is shown. t‐test, *P= 0.002, **P= 0.004 and ***P= 0.009 compared with pGFP‐only transfected cells. (B) MEL202 cell expressing GFP‐PERP (green) showing morphological features of apoptosis, including blebbing of the plasma membrane and DNA stained with PI (red) packaged into apoptotic bodies that have lost membrane integrity. (C) 92‐1 UM cells expressing GFP‐PERP (green) showing positive annexin‐V binding (blue) and PI staining (red). A cell committed to apoptosis that has not yet lost membrane integrity is indicated (arrow). The bright field image shows nontransfected cells in the same cell population, which do not present the apoptotic characteristics.
