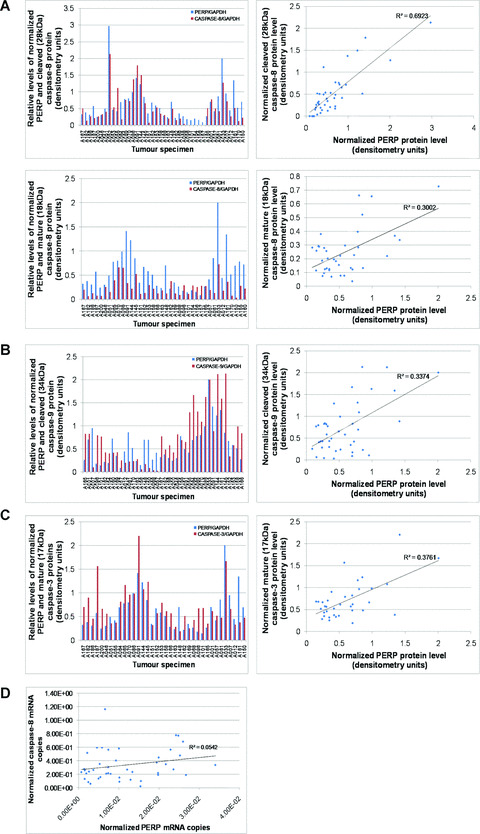
Figure 6.

Evaluation of PERP protein expression and caspase activation in primary UM specimens. Comparison of PERP protein levels with (A) partially processed 28 kD caspase‐8 (critical R 2 value = 0.239 at P= 0.001, n= 42) and active 18 kD caspase‐8 (critical R 2 value = 0.261 at P= 0.001, n= 38), (B) cleaved 34 kD caspase‐9 (critical R 2 value = 0.249 at P= 0.001, n= 40) and (C) active 17 kD caspase‐3 (critical R 2 value = 0.273 at P= 0.001, n= 36). The levels of PERP protein and cleaved caspase proteins, determined by densitometry following Western blot analysis, were normalized to the corresponding GAPDH protein level in UM homogenates. The square of the Pearson product‐moment correlation was calculated in each case and significant and positive rank correlations were determined (calculated R 2 values indicated on graphs). (D) Evaluation of relative transcriptional levels of PERP and procaspase‐8 in primary UM specimens. Quantification of mRNA copy number of PERP and procaspase‐8 was achieved by real‐time PCR, as described in Methods; normalization was against specimen‐specific LDHA mRNA copy number. No significant correlation was found between PERP and caspase‐8 at the transcriptional level (Pearson’s product‐moment correlation, critical R 2 value = 0.098 at P= 0.05, n= 43).
