Abstract
H2B histone family, member W, testis‐specific (H2BFWT) gene encodes a testis‐specific histone that becomes incorporated into sperm chromatin. A male infertility‐associated single nucleotide polymorphism (−9C > T) within the 5′ untranslated region (5′UTR) of the H2BFWT gene was identified by direct sequencing. Statistical association studies showed the polymorphism significantly associated with male infertility (n= 442, P= 0.0157), especially in non‐azoospermia (n= 262, P= 0.018). Furthermore, this polymorphism is also associated with sperm parameters, especially sperm count (n= 164, P= 0.0127) and vitality (n= 164, P= 0.0076). We investigated how the genetic variant at 5′UTR confers susceptibility to non‐azoospermia. Western blotting of His‐tag H2BFWT revealed a difference at the translational level between ‐9T and the wild‐type −9C in the absence of change at the transcriptional level. Reporter assays showed that this reducing translational change originated from an upstream open reading frame (uORF) generated by the −9C to −9T change. Finally, in vivo H2BFWT expression in sperm was significantly dependent on the −9C > T genotype from non‐azoospermia (P= 0.0061). Therefore, this polymorphism could affect the translational efficiency of a quantitatively important histone protein by the uORF. Our data implicate H2BFWT as a susceptibility factor for male infertility, possibly with other genetic and environmental factors.
Keywords: H2BFWT, 5′UTR, uORF, single nucleotide polymorphism, male infertility
Introduction
Spermatogenesis involves the processes of germ cell proliferation and differentiation by mitosis and meiosis. During spermatogenesis, the chromatin of the spermatogenic cells is profoundly reorganized and somatic histones are partly replaced by testis‐specific histones [1]. The somatic histones that are present at the onset of the differentiation process undergo several transitions. In mature spermatozoa, protamines consist of the main chromosomal component [2, 3]. In human beings, unlike other mammals including the mouse, core histones (H2A, H2B, H3 and H4) are not displaced completely during spermiogenesis and account for approximately 15% of the basic chromosomal proteins within the mature sperm [4, 5, 6].
Human testis‐specific histones are detected in spermatogonia as well as mature sperm [1, 7, 8, 9, 10, 11]. The functions of these proteins may be similar to their somatic counterparts, but this remains to be fully elucidated. Some functions of testis‐specific histones during spermatogenesis have been previously reported [12, 13, 14, 15]. Importantly, a decrease in testis‐specific histone can result in sperm morphological abnormalities and male subfertility [16, 17].
However, genetic variants of the testis specific histones have not hitherto been associated with male infertility.
The H2B histone family, member W, testis‐specific (H2BFWT) was recently identified. The gene encoding this histone is located on chromosome Xq22.2, and its amino acid sequence demonstrates a 45% homology to that of the somatic H2B. H2BFWT is expressed in sperm nuclei; a previous study demonstrated that the H2BFWT protein is co‐localized with telomeric sequences [11]. The H2BFWT gene may be important to human spermatogenesis, but there has been no investigation relating it to any human disease.
In this paper, we screened for genetic variations in the H2BFWT gene from infertile men and investigated the possible role of −9C > T polymorphism (The A of ATG is designated as +1) at 5′ untranslated region (5′UTR) to determine its basic mechanism for male infertility.
Materials and methods
Infertile men and controls
Two hundred thirty‐six fertile men who had at least one child and who lacked any history of requiring assisted reproductive technology were included as the control group. This control group was consecutively enrolled from the Division of Genome Resources, National Genome Research Institute, National Institutes of Health, and from Korea. From January 2000 to December 2006, after conducting physical exams and hormone assays, 442 non‐obstructive infertile men without any chromosome abnormalities (including Klinefelter syndrome and Y chromosomal microdeletions) were included. They were classified into two subtypes: azoospermia (no spermatozoa in the ejaculate; n= 180) and non‐azoospermia (spermatozoa in the ejaculate, but infertile; n= 262). The diagnoses of azoospermia and non‐azoospermia were made on the basis of two semen analyses performed according to World Health Organization recommended procedures. Non‐azoospermia included men having at least one abnormality in sperm concentration (<20 × 106), motility (<50%), or morphology (<14%). The experiments were performed at the CHA General Hospital, Seoul, Korea. Informed consent was required to participate in this study.
Cytogenetic analysis
Cytogenetic analysis was performed on metaphase spreads from cultured lymphocytes [18, 19]. For Yq deletion studies, DNA was extracted from peripheral blood and amplified using a multiplex‐polymerase chain reaction (PCR) kit with primers to 15 loci on the Y chromosome, including one SRY and 14 sequence‐tagged sites, according to the manufacturer’s instructions (AZF‐a region: sY84, sY86; AZF‐b region: sY124, sY127, sY130, sY138; AZF‐c region: sY152, sY147, sY254, sY255, SPGY1, sY157, sY242, sY158) (GYMG‐003, Genocheck, Ansan, Korea).
Direct sequencing of the transcribed region of the H2BFWT gene from genomic DNA
Genomic DNA was isolated from peripheral blood by protease and phenol purification. The H2BFWT gene (5′UTR and exon 1) was amplified for sequencing analysis using the following primers: forward primer, 5′‐ATGGATCAGCTGAGAA GGGC‐3′; reverse primer: 5′‐GAAA AGACCCTTTGGGTTCC‐3′. The PCR‐amplified fragments were used for thermal cycle sequencing (Applied Biosystems, Foster City, CA, USA). All DNA sequences were determined using the same PCR primers.
Vector construction
Three reporter systems (His‐tag‐H2BFWT, green fluorescent protein [GFP] and luciferase) with an upstream 1.2‐kb fragment of H2BFWT were designed, and eight report vectors were constructed. The upstream 1.2‐kb fragment (from –1215 to –1, positions relative to the first base of the start codon at +1) containing the promoter and 5′UTR of the human H2BFWT gene was prepared by PCR amplification using human genomic DNA as a template. The sequences of the specific primers were; 5′‐CCGCTCGAGTGTGGACAGGTCTCTTGTGCCTTGT‐3′ and 5′‐CAT GCCATGGCTCCACGTCTCGGGCCAGCTTCACGTCTGATT‐3′ (the underlined letter denotes position +1 and the bold letter denotes position –9, respectively). The PCR product was cloned into the yT&A cloning vector (Yeastern Biotech, Taipei, Taiwan). The 1.2‐kb insert was transferred to a pGL3 vector to construct pGL3 −9C and −9T. pH2BFWT‐HIS −9C and −9T were constructed of original H2BFWT sequences with a histidine tag (His‐tag, 6 histidines). The full‐length cDNA for H2BFWT containing the His‐tag was replaced with luciferase for pH2BFWT‐HIS −9C and −9T plasmids. pGL3EGFP −9C and −9T were constructed for the GFP reporter assay. The enhanced green fluorescence protein (EGFP) gene was amplified and inserted into the pGL3‐basic plasmid (Promega, Madison, WI, USA), which removed the luciferase gene between the NcoI and XbaI sites for the pGL3EGFP plasmid. pGL3EGFP ‐9C and ‐9T plasmids were prepared by subcloning the respective 1.2‐kb fragments into pGL3EGFP. All constructions are shown in Fig. 1(A). pGL3EGFP −9C ins TG (insertion of TG) and −9T ins TG types were also constructed by PCR with various reverse primers and cloning into pGL3EGFP −9C and −9T for testing the upstream open reading frame (uORF). GFP report constructions of −9C ins TG(insertion of TG) at +7 and ‐9T ins TG at +7 are shown in Fig. 3(A).
Figure 1.
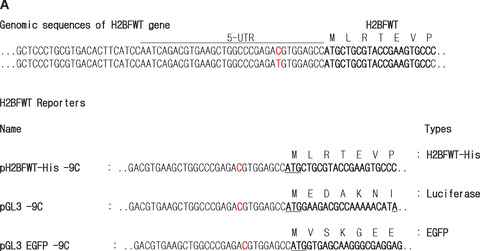
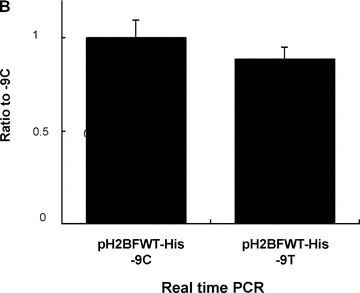
Constructs for reporter assays. (A) The genomic sequences of the H2BFWT gene near the 5′UTR are shown on top. A 1.2‐kb fragment (–1215 to –1) containing the promoter and 5′UTR of the human H2BFWT gene was prepared. The partial sequences for three reporters (pH2BFWT‐His, pGL3 and pGL3EGF) are shown. The red letters indicate the nucleotide sequence at the −9 position, and each construct is the −9T or −9C type. (B) Real‐time PCR analysis measuring H2BFWT mRNA levels from each construct. Total RNA was extracted from 293T cells transfected by pH2BFWT‐His −9C and −9T. The mRNA levels in each lane were normalized against GAPDH expression. The experiment was repeated three times.
Figure 3.

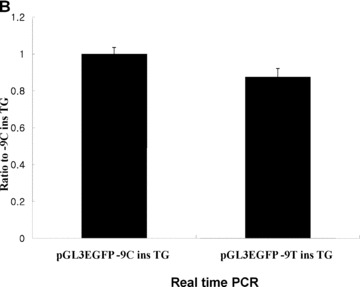
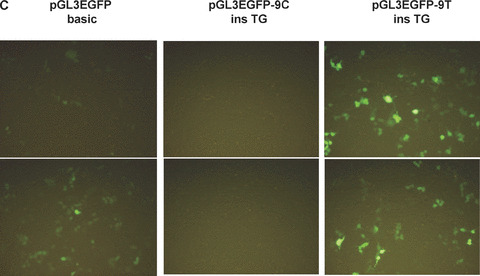
Effect of frame shift. (A) The partial sequences for construction of pGL3EGFP −9C ins TG and ‐9T ins TG are shown. Protein sequences are indicated with arrows, and the possible uORF starting at the −10 position is in frame with GFP. (B) Real‐time PCR analysis measuring H2BFWT mRNA levels from each construct. Total RNA was extracted from 293T cells transfected by pH2BFWT‐His −9C ins TG and −9T ins TG. The mRNA levels were normalized against GAPDH expression and graphed as the ratio relative to pH2BFWT −9C ins TG. The experiment was repeated three times with three independent transfected cells per each construct, (C) Fluororescence image of 293T cells 48 hrs after transfection of pGL3EGFP basic, pGL3EGFP ‐9C ins TG and pGL3EGFP −9T ins TG. The experiment was repeated three times. (D) GFP fluorescence activity was measured and graphed as the ratio relative to pGL3EGFP basic.
Real‐time PCR analysis
Total RNA was isolated from HEK293T cells of pH2BFWT reporters (pH2BFWT ‐His −9C, −9T, −9C ins TG at +7 and −9T ins TG at +7) using QIAGEN RNA‐Mini kits (Qiagen, Valencia, CA, USA) according to the manufacturer’s instructions. All RNA preparations were treated with DNase I (Roche, Basel, Switzerland and Boehringer–Mannhein, Mannheim, Germany). For RNA analysis, equivalent amounts of total RNA served as a template for cDNA synthesis using reverse‐transcriptase (Invitrogen, Carlsbad, CA, USA). Quantitative real‐time RT‐PCR assays were carried out in a Rotor‐Gene 2000 fluorometric thermal cycler (Qiagen). For quantitative real‐time RT‐PCR, SYBR‐Green (Qiagen) was added to the reaction mixture, and fluorescence was measured after each cycle. After the native cDNA copy number of each gene was calculated using the comparative ΔΔCT method for each sample, the relative ratios of the tested gene to glyceraldehyde 3‐phosphate dehydrogenase (GAPDH) were generated. Primers sequences were H2BFWT forward 5′‐GTGTCATGGATTXTTTGGTT‐3′ and reverse 5′‐CATCACTGCCTGGGAGAC‐3′. Each data point represents the mean ± S.D. values for three measurements.
Reporter assay
For the GFP and luciferase assays, HEK293T cells were seeded into Dulbecco’s minimal essential medium supplemented with 10% foetal bovine serum. One microgram of each reporter plasmid was transfected using Welfect‐EX PLUS (Welgene, Daegu, Korea). After 48 hrs of incubation, cells were pelleted and lysed with TNT lysis buffer containing 20 mM Tris, 100 mM NaCl, 1% Triton X‐100, 2 mM ethylenediaminetetraacetic acid, 1 mM AEBSF, 2 μg/ml aprotinin, 2 μg/ml leupeptin and 1 μg/ml pepstatin. The cell lysates were cleared by centrifugation at 10,000 rpm, and the protein concentrations were quantified by the Bradford assay. GFP fluorescence of 400 μg of protein from the cell lysates was measured using a Victor3 multi‐label counter with a fluorescein isothiocyanate (FITC) filter (PerkinElmer Life and Analytical Sciences, Wellesley, MA, USA). The dual‐luciferase reporter assay was also performed on HEK293T cells transfected with pGL3 ‐9C and ‐9T plasmids according to the manufacturer’s instructions (Promega).
Sperm preparation and Protein isolation
Sperm cells were isolated by modified two‐gradient (50–80%) Percoll centrifugation method from ejaculated human semen obtained from 11 non‐azoospermia individuals [20]. Non‐azoospermia patients included six oligozoospermia/asthenozoospermias and five asthenozoospermias patients. Sperm pellet was washed three times and re‐suspended with phosphate buffered saline (PBS), and then re‐analysed by Sperm Class analyser system (Microptic S.L., Barcelona, Spain). Sperm pellet (≥99% purity) after re‐centrifugation were re‐suspended with denaturing lysis buffer (20 mM Tris, pH 7.4, 2% SDS, 1 mM phenyl methane sulphonyl fluoride (PMSF)), and then boiled for 10 min. The supernatant was collected after centrifugation, and the protein amount was quantitated by bicinchoninic acid (BCA) assay. Total protein amount is dependent on sperm number because of its purity (≥99%). Forty micrograms of protein obtained from each patient was load into each lane for SDS‐PAGE (12%).
Western blot analysis
For Western blot of His‐tag protein, 293T cells co‐transfected by pH2BFWT‐His (−9C or −9T) and pGL3EGFP basic plasmids were harvested and washed with phosphate buffered saline. Cells were incubated in denaturing lysis buffer (20 mM Tris, pH 7.4, 2% SDS) and boiled for 10 min. Cells were centrifuged 13,000 rpm for 10 min., the supernatant were collected.
Western blot analysis was performed with mouse His‐Tag Antibody (Chemicon, Billerica, MA, USA), rabbit anti‐EGFP protein (Santa Cruz Biotechnology, Santa Cruz, CA, USA) and rabbit anti‐H2BFWT (a gift of Dr.Andrei Zalensky from Eastern Virginia Medical School) at as primary antibody and horseradish peroxidase conjugated secondary antibody (Zymed, San Francisco, CA, USA). A low molecular weight ladder (BioRad, Hercules, CA, USA) was used. The blots were developed by chemiluminence kit (PIERCE, Rockford, IL, USA) and the image was detected by LAS‐3000 imaging system (FUJIFILM Life Science, Stanford, CT, USA).
Statistical analyses
SAS Ver. 8.1 (SAS Institute, Cary, NC, USA) was used for odds ratio (OR) and 95% confidence interval (CI) estimations. Results for the enumeration of data (e.g. the number of individuals with various genotypes) and comparison of percentages between groups were evaluated with logistic regression test. Allele frequencies were calculated by allele counting. P‐values < 0.05 were taken as statistically significant. For quantitation of in vivo H2BFWT expression from sperm, Graphpad Prism 4 program was used with Mann‐Whitney test.
Results
−9C > T polymorphism of the H2BFWT gene was significantly associated with male infertility
In this study, we investigated the sequence variation of the H2BFWT gene by direct sequencing in a case–control study using peripheral blood DNA from 442 infertile and 236 fertile Korean men. Direct sequencing analysis revealed three polymorphic sites (−14C > T, −9C > T and +368A > G; +1 is translation start site) within H2BFWT gene. Two polymorphisms (−14C > T and −9C > T) were located within the 5′UTR and the other (+368A > G) was located within exon 1, which was a non‐synonymous polymorphism (H > R). The −9C > T (rs7885967) and +368A > G (rs553509) polymorphisms have already been reported by the National Center for Biotechnology Information; however, −14C > T is a novel single nucleotide polymorphism (SNP) that has not yet been reported. There were no other polymorphisms found from this group of Korean men. We evaluated whether these three polymorphisms were associated with male infertility in our patient population.
The genotype of each polymorphism was either a dominant or a recessive homozygote type. Heterozygotes were not detected because the H2BFWT gene was located on the X chromosome (46, XY). The frequency of the −14C > T (T) polymorphism among the fertile and infertile men was 3.8% and 2.5%, respectively (n= 442, P > 0.05) (Table 1). The frequency of the +368A > G (G) polymorphism was 42.54% (fertile men) and 41.60% (infertile men), which indicates that this +368A > G polymorphism was not associated with male infertility (P > 0.05). However, the frequency of the ‐9C > T (T) polymorphism was 36.2% (fertile men, n= 213) and 46.36% (infertile men, n= 442). Statistical analysis revealed that this −9C > T polymorphism was significantly associated with male infertility (P= 0.0157) (Table 1).
Table 1.
Distribution of H2BFWT −9C/T and −14 C/T genotypes
| −9C | −9T | OR (95% CI) | P | ||
|---|---|---|---|---|---|
| Fertile men (n= 213) | 63.8% (n= 136) | 36.2% (n= 77) | |||
| Infertile men (n= 442) | 53.8% (n= 238) | 46.2% (n= 204) | 1.514 (1.08–2.12) | 0.0157* | |
| Azoospermia (n= 180) | 55% (n= 99) | 45% (n= 81) | 1.407 (0.94–2.19) | 0.1015 | |
| Non‐azoospermia (n= 262) | 53% (n= 139) | 46% (n= 123) | 1.563 (1.08–2.26) | 0.0180* | |
| −14C | −14T | OR (95% CI) | P | ||
| Fertile men (n= 213) | 96.2% (n= 205) | 3.8% (n= 8) | |||
| Infertile men (n= 442) | 97.5% (n= 431) | 2.5% (n= 11) | 0.654 (0.26–1.65) | 0.368 | |
| Azoospermia (n= 180) | 97.7% (n= 176) | 2.3% (n= 4) | 0.557 (0.17–1.88) | 0.3459 | |
| Non‐azoospermia (n= 262) | 97.3% (n= 255) | 2.7% (n= 7) | 0.703 (0.25–1.97) | 0.5036 |
*P < 0.05 for the statistical difference between −9T and −9C genotypes in infertile and non‐azoospermia group.
We subclassified infertile men into two subgroups: non‐azoospermia group (spermatozoa in the ejaculate; n= 262) and azoospermia group (no spermatozoa in the ejaculate; n= 180), and analysed the association of the −9C > T (T) polymorphism with each group. Interestingly, the −9T type was associated with non‐azoospermia (P= 0.018), but not with azoospermia (P= 0.1015) (Table 1).
Therefore, we further investigated −9C > T genotype with sperm cell pathophysiology, and analysed its association with four sperm parameters from non‐azoospermia patients (n= 164). The sperm count and vitality were significantly associated with −9C > T polymorphism (P < 0.05), but the motility and morphology of the sperm were not dependent on the genotype (P > 0.05). The −9C type had an almost threefold higher sperm count (−9C; 36.54 ± 48.63 versus−9T; 11.09 ±18.99, P= 0.0127) and twofold higher vitality (−9C; 44.39%±21.44 versus−9T; 22.00%±23.01, P= 0.0076) than −9T type from non‐azoospermia (Table 2).
Table 2.
Sperm count, motility, vitality and morphology according to ‐9C/T genotype of non‐azoospermia
| Sperm parameter | Genotype | n | Average (SD) | P‐value* |
|---|---|---|---|---|
| Sperm count | −9C | 93 | 36.54 (±48.63) | |
| (106/ml) | 0.0127 | |||
| −9T | 71 | 11.09 (±18.99) | ||
| Motility | −9C | 93 | 20.16% (±17.15) | |
| (%) | 0.312 | |||
| −9T | 71 | 22.85% (±16.68) | ||
| Vitality | −9C | 93 | 44.39% (±21.44) | |
| (%) | 0.0076 | |||
| −9T | 32 | 22.00% (±23.01) | ||
| Morphology | −9C | 91 | 2.30% (±2.18) | |
| (%) | 0.548 | |||
| −9T | 12 | 1.91% (±1.44) |
*P < 0.05 for the statistical significance between −9T and −9C genotypes in non‐azoospermia group.
Construction of reporters for investigation of the role of 5′UTR −9C > T polymorphism
To determine whether the −9C > T polymorphism could affect the expression level of the H2BFWT gene, we constructed three different reporters expressing the whole H2BFWT gene with His‐tag, GFP or luciferase, with 5′UTR sequences (C or T at −9 position). A 1.2‐kb fragment containing the promoter and 5′UTR of the human H2BFWT gene was prepared by PCR amplification from a human genomic DNA template. First, we constructed −9C and −9T types of reporters to directly compare its polymorphic effect (Fig. 1A). These reporters have the same sequences (both −14C type) except at the −9 site. In the −9T type, an alternative start codon was generated in all reporters that resulted in an uORF starting at −10A. Therefore, the −9T construct could have an alternative, out‐of‐frame start codon within its 5′UTR, which would result in a frame shift and incomplete translation.
mRNA expression of different genotypes
After transfection of HEK293T cells with the pH2BFWT reporters, we compared transcriptional levels of each reporter by real‐time PCR (Fig. 1B). The two constructs (pH2BFWT −9C and −9T) had similar RNA levels after normalization against GAPDH expression, which suggested that the different reporter sequences did not affect the transcriptional levels. Northern blot experiments and RT‐PCR analysis with pGL3EGFP −9C and −9T transfected cells also showed no transcriptional changes (data not shown).
Comparison of translation level of −9C and −9T transfected cell lines by three different report assays
We tested whether there was any change in translational efficiency between the different sequences at the −9 position within the 5′UTR. Western blot analysis was performed with protein extracts from 293T cells transfected by pH2BFWT‐His −9C and −9T. The transfection efficiency was normalized with co‐transfection by pGL3EGFP basic. The expression of C‐terminal His‐tagged H2BFWT protein was detected with His‐Tag antibody. Two bands were apparent; the upper band was the appropriate size with the lower band likely representing the alternative splicing form. Both the −9T and −9C types displayed weakly evident small molecular weight bands and total intensity of H2BFWT was normalized with EGFP at each lane, and graphed as the ratio relative to pH2BFWT‐His −9C (Fig. 2B). Images of cell lines containing the pGL3EGFP −9C and pGL3EGFP −9T types with pGL3EGFP basic are shown in Fig. 2(C). Strong GFP expression was observed for the pGL3EGFP −9C containing cells. GFP fluorescence from each cell line was measured by spectrofluorometry and graphed (Fig. 2D). The wild‐type (−9C) had almost threefold more fluorescence activity relative to the −9T type. We also tested luciferase expression for the reporter constructs bearing the −9T and −9C types. The pGL3 −9C type had more than twofold higher activity than the pGL3 −9T type (Fig. 2E). All reporter assays suggested that the polymorphism of −9C > T within the 5′UTR significantly affected reporter gene expression, which somehow significantly inhibited translation of the −9T type.
Figure 2.
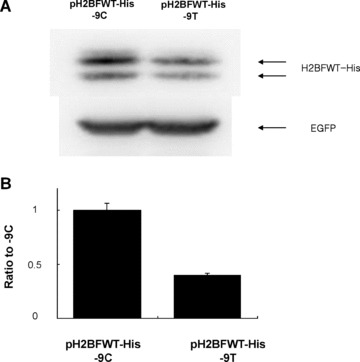
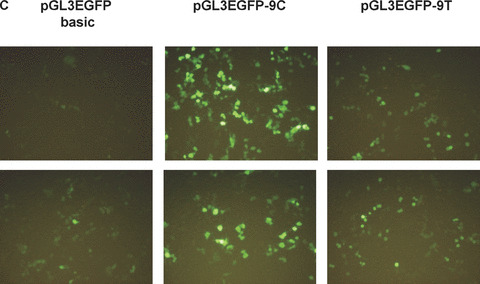
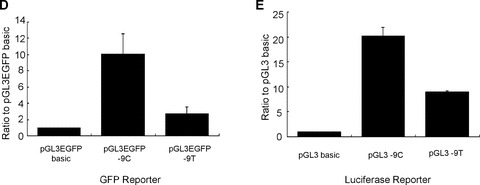
Effects of different tranfections. (A) Western blot analysis of 293T cells co‐transfected by pH2BFWT‐His (−9C and −9T) and pGL3EGFP basic. Primary antibody was directed to His‐Tag (upper) and EGFP (lower). (B) The total intensity of H2BFWT was normalized with GAPDH, and graphed as the ratio relative to pH2BFWT‐His −9C. (C) Fluororescence image of 293T cells 48 hrs after transfection of pGL3EGFP basic, pGL3EGFP ‐9C and pGL3EGFP −9T. (D) GFP fluorescence activity was measured and graphed as the ratio relative to pGL3EGFP basic. (E) Luciferase activities of 293T cells transfected by pGL3 −9C and −9T were measured and graphed as the ratio relative to pGL3 basic. The experiment was repeated three times.
Comparison of GFP‐translation from pGL3EGFP −9C ins TG at +7 and −9T ins TG at +7 in transfected cell lines
The conversion of −9C to T may generate a uORF that starts at the −10 position, which results in a frame shift relative to the wild‐type H2BFWT gene. We constructed pGL3EGFP − 9C ins TG at +7 position and −9T ins TG at +7 position to test for translation of this uORF (Fig. 3A). The two ins TG at +7 types (−9C ins TG at +7 and −9T ins TG at +7) have a ‘TG’ insertion at the +7 position, which would encode a polypeptide only two amino acids in length if the translation were to start at the authentic ATG codon (+1A). However, if translation starts at upstream (the −10 position) at pGL3EGFP −9T ins TG type, it would be in frame with GFP. To test the possibility of active translation of this uORF from the −9T type, The −9C ins TG at +7 and −9T ins TG at +7 type constructs with pGL3EGFP basic are shown in Fig. 3(A). After transfection of HEK293T cells with two pH2BFWT reporters (three different cells per each reporter), we also compared transcriptional levels of each reporter by real‐time PCR (Fig. 3B). Two constructs (pH2BFWT −9C ins TG at +7 and −9T ins TG at +7) had similar RNA levels after normalization against GAPDH expression with three repeat experiments.
We finally compared the GFP translational level of pGL3EGFP basic, pGL3EGFP −9C ins TG at +7 and −9T ins TG at +7 transfected cells. There was almost no GFP activity from pGL3EGFP −9C ins TG, but substantial GFP expression was observed from pGL3EGFP −9T ins TG (Fig. 3C). GFP fluorescence from each cell line was measured by spectrofluorometry and graphed (Fig. 3D). There was no significant fluorescence activity from pGL3EFG −9C ins TG, but more than three times the background GFP was observed from pGL3EGFP −9T ins TG normalized with pGL3EGFP basic (Fig. 3C). The varying translation efficiency between −9T and −9C type may partially reflect the ability of the −9T type to directly translate the uORF created at the −10 site in this allele. The −9C > T polymorphism affected the translational efficiency of the H2BFWT gene and, thus, may be related to defects in important sperm parameters.
The expression H2BFWT protein from sperm of non‐azoospermia
To further verify whether H2BFWT is expressed dependent on −9C > T genotype in vivo, we did Western blot experiment with total sperm proteins from 11 non‐azoospermia patients (6 Oligozoospermia/Asthenozoospermias, 5 Asthenozoospermias). The H2BFWT expression (about 20 kD) was determined from seven −9C and four −9T types of non‐azoospermia patients (Fig. 4A). The expression level was measured by relative optical density, and graphed (Fig. 4B). The average of H2BFWT expression of −9C type (relative optical density [ROD]= 1.49) is about five times higher than that of −9T type (ROD = 0.29), which indicated by arrows. The median value is 0.31 in −9T type as compared to 1 in −9C type. Mann‐Whitney test showed this H2BFWT reduction of −9T type is statistically significant (P= 0.0061).
Figure 4.

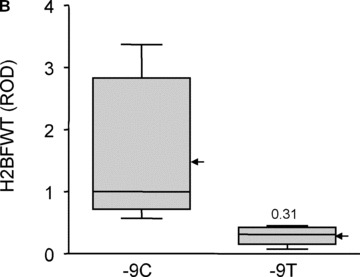
In vivo H2BFWT expression. (A) The H2BFWT protein expression from sperm of non‐azoospermia was determined by Western blot experiment. The genotype of each sample was indicated on each lane. (B) The intensity of each single band was determined, and graphed by box and whisker diagram. ROD means relative optical density, and the median value is indicated inside bar (1 for −9C and 0.31 for −9T). The arrow indicates the mean value of each type.
Discussion
The H2BFWT gene encodes a testis specific H2B, member W, that can replace somatic histones during spermatogenesis [11]. In this study, we found that the −9C/T polymorphism of H2BFWT is associated with sperm parameters, possibly by the creation of an uORF. The present observations are the first to link expression of H2BFWT as being influential for spermatogenesis.
Translational regulation is an important component for the control of gene expression. The most important step during translation is initiation, which involves the formation of an elongation‐competent 80S ribosome at a start codon either by the ribosome scanning mechanism or by a cap‐independent mechanism [21, 22]. The prevalence of mRNAs with complex 5′UTRs containing one or more upstream AUGs and upstream ORFs is now estimated to occur in approximately 50% of all human mRNAs. This observation has renewed interest in the role of these features in post‐transcriptional gene regulation [23, 24, 25, 26]. Empirical evidence indicates that upstream AUGs and/or ORFs can significantly diminish translation of the main ORF by reducing the number of ribosomes reaching and initiating at the authentic AUG start codon [27, 28, 29, 30, 31]. Some important disease associated polymorphisms have been reported at 5′UTR [32, 33, 34].
Comparison of Kozak consensus sequences near ORF (GCC ATG C) and uORF (GAG ATG T) may be important to understand this genotype‐specific reduction of expression. The ideal Kozak context in higher eukaryotes is the R (A or G) at −3 and the G at +4 (The A of ATG is designated as +1). Both Kozak consensus sequences have strong consensus G sequence at −3, but C (ORF) or T (uORF) at +4. Therefore, both sequences seem to have similar expression, and so finally uORF expression could affect authentic (ORF) expression in vivo.
The −14C/T polymorphism is located at Kozak consensus sequence (C/T GAG ATG T) of uORF, and may influence its uORF expression. However, the statistical analysis showed this SNP has no association with male infertility (P= 0.368), and either with non‐azoospermia patients (P= 0.5036). The allele frequency of −14C/T site is quite low (2.5% infertile and 3.8% fertile men) and the difference is only 1.3% (Table 1). Statistical analysis with infertile subtypes showed that this polymorphism is associated with non‐azoospermia but not azoospermia. More than half of the protein synthesis was reduced at the −9T type by the uORF, which suggests that reduced amount of H2BFWT proteins may not be too critical for spermatogenesis. In case of the ‐9C type, the H2BFWT expression in sperm is strong, but varies from the ‐9T type. Therefore, ‐9C > T polymorphism is a genetic risk factor, but not a determining factor. There is also high frequency of the ‐9T type from fertile men (36.2%). It is possible that other mechanisms for escaping uORF, possibly TSH2B expression may exist during spermatogenesis.Our data are the first report of a disease associated SNP generating uORF. Our approach will help to understand the function of SNP at 5′UTR for various disease association studies.
Acknowledgements
This study was supported by a grant of the Korea Health 21 R&D Project, Ministry of Health & Welfare, Republic of Korea (01‐PJ10‐PG6–01GN13–0002). We thank Jee‐Eun Kim and Han‐Chul Lee for initial work of the H2BFWT study. In addition, we greatly appreciate Dr. Andrei Zalensky of Eastern Virginia Medical School, USA for providing the H2BFWT antibody.
References
- 1. van Roijen HJ, Ooms MP, Spaargaren MC et al . Immunoexpression of testis‐specific histone 2B in human spermatozoa and testis tissue. Hum Reprod. 1998; 13: 1559–66. [DOI] [PubMed] [Google Scholar]
- 2. Oliva R, Dixon GH. Vertebrate protamine genes and the histone‐to‐protamine replacement reaction. Prog Nucleic Acid Res Mol Biol. 1991; 40: 25–94. [DOI] [PubMed] [Google Scholar]
- 3. Lewis JD, Song Y, de Jong ME, et al . A walk though vertebrate and invertebrate protamines. Chromosoma. 2003; 111: 473–82. [DOI] [PubMed] [Google Scholar]
- 4. Gatewood JM, Cook GR, Balhorn R, et al . Sequence‐specific packaging of DNA in human sperm chromatin. Science. 1987; 236: 962–4. [DOI] [PubMed] [Google Scholar]
- 5. Gusse M, Sautiere P, Belaiche D, et al . Purification and characterization of nuclear basic proteins of human sperm. Biochim Biophys Acta. 1986; 884: 124–34. [DOI] [PubMed] [Google Scholar]
- 6. Tanphaichitr N, Sobhon P, Taluppeth N, et al . Basic nuclear proteins in testicular cells and ejaculated spermatozoa in man. Exp Cell Res. 1978; 117: 347–56. [DOI] [PubMed] [Google Scholar]
- 7. Steger K, Klonisch T, Gavenis K, et al . Expression of mRNA and protein of nucleoproteins during human spermiogenesis. Mol Hum Reprod. 1998; 4: 939–45. [DOI] [PubMed] [Google Scholar]
- 8. Yan W, Ma L, Burns KH, et al . HILS1 is a spermatid‐specific linker histone H1‐like protein implicated in chromatin remodeling during mammalian spermiogenesis. Proc Natl Acad Sci USA. 2003; 100: 10546–51. [DOI] [PMC free article] [PubMed] [Google Scholar]
- 9. Zalensky AO, Siino JS, Gineitis AA, et al . Human testis/sperm‐specific histone H2B (hTSH2B). Molecular cloning and characterization. J Biol Chem. 2002; 277: 43474–80. [DOI] [PubMed] [Google Scholar]
- 10. Witt O, Albig W, Doenecke D. Testis‐ specific expression of a novel human H3 histone gene. Exp Cell Res. 1996; 229: 301–6. [DOI] [PubMed] [Google Scholar]
- 11. Churikov D, Siino J, Svetlova M, et al . Novel human testis‐specific histone H2B encoded by the interrupted gene on the X chromosome. Genomics. 2004; 84: 745–56. [DOI] [PubMed] [Google Scholar]
- 12. Moss SB, Challoner PB, Groudine M. Expression of a novel histone 2B during mouse spermiogenesis. Dev Biol. 1989; 133: 83–92. [DOI] [PubMed] [Google Scholar]
- 13. Drabent B, Bode C, Miosge N, et al . Expression of the mouse histone gene H1t begins at premeiotic stages of spermatogenesis. Cell Tissue Res. 1998; 291: 127–32. [DOI] [PubMed] [Google Scholar]
- 14. Moss SB, Orth JM. Localization of a spermatid‐specific histone 2B protein in mouse spermiogenic cells. Biol Reprod. 1993; 48: 1047–56. [DOI] [PubMed] [Google Scholar]
- 15. Meistrich ML, Bucci LR, Trostle‐Weige PK, et al . Histone variants in rat spermato gonia and primary spermatocytes. Dev Biol. 1985; 112: 230–40. [DOI] [PubMed] [Google Scholar]
- 16. Tanaka H, Iguchi N, Isotani A, et al . HANP1/H1T2, a novel histone H1‐like protein involved in nuclear formation and sperm fertility. Mol Cell Biol. 2005; 25: 7107–19. [DOI] [PMC free article] [PubMed] [Google Scholar]
- 17. Couldrey C, Carlton MB, Nolan PM, et al . A retroviral gene trap insertion into the histone 3.3A gene causes partial neonatal lethality, stunted growth, neuromuscular deficits and male sub‐fertility in transgenic mice. Hum Mol Genet. 1999; 8: 2489–95. [DOI] [PubMed] [Google Scholar]
- 18. Manti L, Durante M, Grossi G, et al . Measurements of metaphase and interphase chromosome aberrations transmitted through early cell replication rounds in human lymphocytes exposed to low‐LET protons and high‐LET (12)C ions. Mutat Res. 2006; 596: 151–65. [DOI] [PubMed] [Google Scholar]
- 19. Lee S, Lee SH, Chung TG, et al . Molecular and cytogenetic characterization of two azoospermic patients with X‐autosome translocation. J Assist Reprod Genet. 2003; 20: 385–9. [DOI] [PMC free article] [PubMed] [Google Scholar]
- 20. Bongso A, Ng SC, Mok H, et al . Improved sperm concentration, motility, and fertilization rates following Ficoll treatment of sperm in a human in vitro fertilization program. Fertil Steril. 1989; 51: 850–4. [DOI] [PubMed] [Google Scholar]
- 21. Jackson RJ, Kaminski A. Internal initiation of translation in eukaryotes: the picornavirus paradigm and beyond. Rna. 1995; 1: 985–1000. [PMC free article] [PubMed] [Google Scholar]
- 22. Hellen CU, Sarnow P. Internal ribosome entry sites in eukaryotic mRNA molecules. Genes Dev. 2001; 15: 1593–612. [DOI] [PubMed] [Google Scholar]
- 23. Suzuki Y, Ishihara D, Sasaki M, et al . Statistical analysis of the 5’ untranslated region of human mRNA using “Oligo‐Capped” cDNA libraries. Genomics. 2000; 64: 286–97. [DOI] [PubMed] [Google Scholar]
- 24. Rogozin IB, Kochetov AV, Kondrashov FA, et al . Presence of ATG triplets in 5’ untranslated regions of eukaryotic cDNAs correlates with a ‘weak’ context of the start codon. Bioinformatics. 2001; 17: 890–900. [DOI] [PubMed] [Google Scholar]
- 25. Pesole G, Gissi C, Grillo G, et al . Analysis of oligonucleotide AUG start codon context in eukariotic mRNAs. Gene. 2000; 261: 85–91. [DOI] [PubMed] [Google Scholar]
- 26. Kochetov AV, Ischenko IV, Vorobiev DG, et al . Eukaryotic mRNAs encoding abundant and scarce proteins are statistically dissimilar in many structural features. FEBS Lett. 1998; 440: 351–5. [DOI] [PubMed] [Google Scholar]
- 27. Morris DR, Geballe AP. Upstream open reading frames as regulators of mRNA translation. Mol Cell Biol. 2000; 20: 8635–42. [DOI] [PMC free article] [PubMed] [Google Scholar]
- 28. Meijer HA, Thomas AA. Control of eukaryotic protein synthesis by upstream open reading frames in the 5’‐untranslated region of an mRNA. Biochem J. 2002; 367: 1–11. [DOI] [PMC free article] [PubMed] [Google Scholar]
- 29. Kozak M. Pushing the limits of the scanning mechanism for initiation of translation. Gene. 2002; 299: 1–34. [DOI] [PMC free article] [PubMed] [Google Scholar]
- 30. Gray NK, Wickens M. Control of translation initiation in animals. Annu Rev Cell Dev Biol. 1998; 14: 399–458. [DOI] [PubMed] [Google Scholar]
- 31. Cazzola M, Skoda RC. Translational pathophysiology: a novel molecular mechanism of human disease. Blood. 2000; 95: 3280–8. [PubMed] [Google Scholar]
- 32. Miyamoto Y, Mabuchi A, Shi D, et al . A functional polymorphism in the 5’ UTR of GDF5 is associated with susceptibility to osteoarthritis. Nat Genet. 2007; 39: 529–33. [DOI] [PubMed] [Google Scholar]
- 33. Borjel AK, Yngve A, Sjostrom M, et al . Novel mutations in the 5’‐UTR of the FOLR1 gene. Clin Chem Lab Med. 2006; 44: 161–7. [DOI] [PubMed] [Google Scholar]
- 34. Hamai Y, Matsumura S, Matsusaki K, et al . A single nucleotide polymorphism in the 5’ untranslated region of the EGF gene is associated with occurrence and malignant progression of gastric cancer. Pathobiology. 2005; 72: 133–8. [DOI] [PubMed] [Google Scholar]


