
Figure 4.
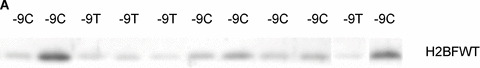
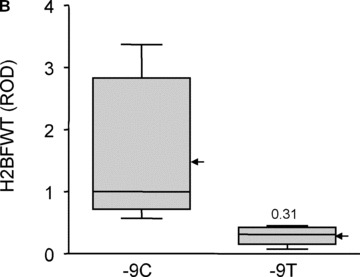
In vivo H2BFWT expression. (A) The H2BFWT protein expression from sperm of non‐azoospermia was determined by Western blot experiment. The genotype of each sample was indicated on each lane. (B) The intensity of each single band was determined, and graphed by box and whisker diagram. ROD means relative optical density, and the median value is indicated inside bar (1 for −9C and 0.31 for −9T). The arrow indicates the mean value of each type.