
Figure 1.
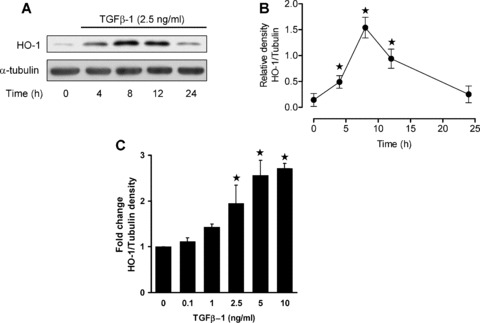
Time‐ and dose‐dependent induction of HO‐1 by TGF‐β1 in HAoSMC. Confluent cultures were equilibrated in medium containing 1% FCS prior to treatment with TGF‐β1 (0.1–10 ng/ml, 0–24 hrs). (A) Immunoblot analyses of HO‐1 protein expression in cells treated with TGF‐β1 (2.5 ng/ml) relative to α‐tubulin used as a loading control and (B) denstometric quantification of HO‐1 expression. (C) Denstometric quantification of immunoblot analyses of HO‐1 expression in cells treated with TGF‐β1 for 12 hrs. Immunoblots are representative of results obtained in n= 3–8 different cell cultures, data are means ± S.E.M., ★P < 0.05 relative to untreated cells.