
Figure 4.
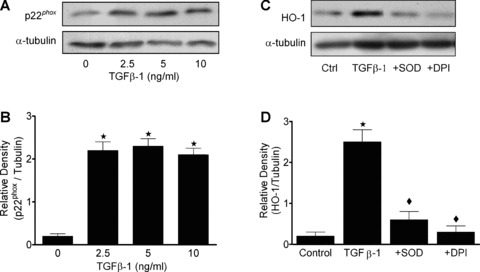
TGF‐β1 enhances expression of p22phox and HO‐1 in HAoSMC. Confluent cultures were equilibrated in medium containing 1% FCS prior to treatment with TGF‐β1 for 12 hrs. (A) Expression of p22phox was determined by western blot analyses relative to α‐tubulin and (B) quantification by densitometry. (C) Immunoblot analyses of HO‐1 protein expression in cells treated with TGF‐β1 (5 ng/ml) in the absence or presence of SOD (200 U/ml) or DPI (2 μM) and (D) quantification by denstometry. Immunoblots are representative of results obtained in n= 3–8 different cell cultures, data are means ± S.E.M., ★P < 0.01 relative to untreated cells, ♦P < 0.01 relative to cells treated with TGF‐β1.