
Figure 1.
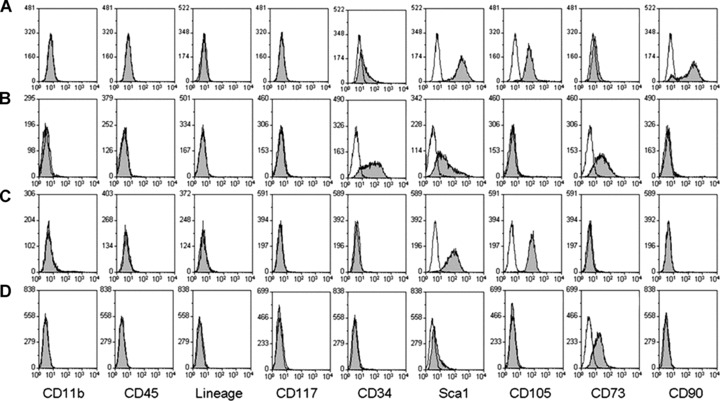
Surface molecule profile of M1P6, M2P5, M4P5 and M2P36. (A) The surface molecule profile of M1 at P6 which were not treated with silica. (B) The surface molecule profile of M2 at P5 which were incubated with silica for 1 hr and were negatively selected. (C) The surface molecule profile of M4 at P5 which were incubated with silica for 4.5 hrs and were negatively selected. (D) The surface molecule profile of M2 at P36. Open peaks were unstained cells as negative control, solid peaks were cells stained with corresponding antibodies after FcR blocking.