Figure 3.

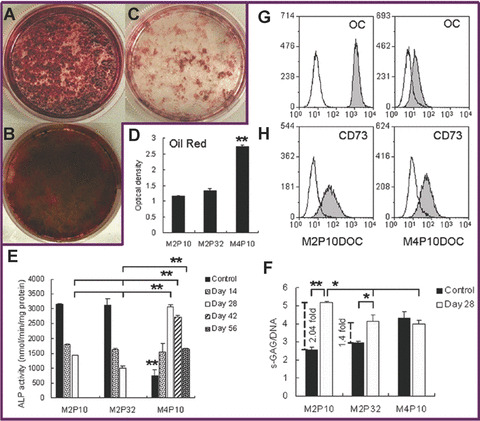
Comparison of tri‐lineage differentiation capability and CD73 expression on M2 and M4. (A) Osteogenesis of M2P10 for 28 days. (B) Osteogenesis of M2P32 for 28 days. (C) Osteogenesis of M4P10 for 28 days. (D) Quantity of oil red extracted from adipogenic progenitors of M2P10, M2P32 and M4P10. (E) ALP activity of osteogenic progenitors of M2P10, M2P32 and M4P10. Dark bars are controls, representing the ALP activity of the same cells cultured in mMSC complete medium. (F) Quantity of s‐GAG synthesis per cell of chondrogenic progenitors of M2P10, M2P32 and M4P10. Dark bars are controls, representing the same cell pellet cultured in chondrogenic differentiation media without TGF‐β1. (G) Synthesis of osteocalcin by day‐28 osteogenic progenitors of M2P10 (left) and M4P10 (right) detected by intracellular fluorescent staining. Open peaks were controls, representing cells stained with the secondary antibody. (H) Expression of CD73 by day‐28 osteogenic progenitors of M2P10 (left) and M4P10 (right). Open peaks were controls, representing unstained cells. All bars in D, E and F represent mean ± S.E. of duplicates of two independent experiments (*, P < 0.05; **, P < 0.01).
