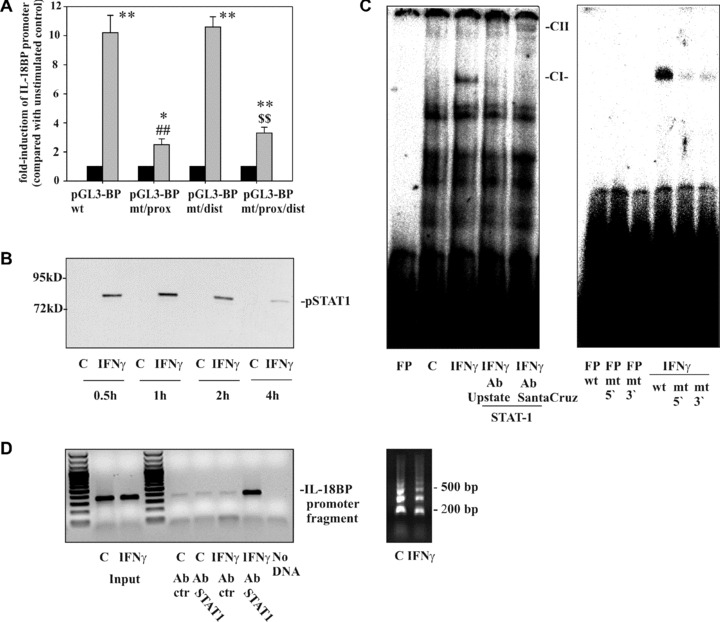
Figure 2.

The role of the STAT1/GAS axis in IL‐18BP promoter activation as detected in DLD‐1 cells. (A) DLD‐1 cells were transfected with the indicated IL‐18BP promoter constructs (pGL3‐BPwt, pGL3‐BPmt/prox, pGL3‐BPmt/dist, pGL3‐BPmt/prox/dist) together with pRL‐TK (Promega) as described in the ‘Materials and methods’ section. After 24 hrs, cells were kept as unstimulated control or stimulated with IFN‐γ (20 ng/ml). After another 6 hrs, cells were harvested and luciferase assays were performed. Data are expressed as mean fold‐luciferase induction ± S.D. (compared to the unstimulated control transfected with the same plasmid) obtained from three independently performed experiments. Black bars: unstimulated control cells, gray bars: IFN‐γ (20 ng/ml). *, P < 0.05 and **, P < 0.01 compared with the respective unstimulated control; ##, P < 0.01 compared with pGL3‐BPwt under the influence of IFN‐γ; $$, P < 0.01 compared with pGL3‐BPmt/dist under the influence of IFN‐γ. (B) DLD‐1 cells were kept as unstimulated control or stimulated with IFN‐γ (10 ng/ml) for the indicated times. Nuclear pSTAT1 was evaluated by immunoblot analysis. One representative of three independently performed experiments is shown. (C) Cells were kept as unstimulated control or stimulated with IFN‐γ (10 ng/ml). After 1 hr, nuclear lysates were prepared and protein binding to oligonucleotides reflecting the proximal GAS site (–18 bp/–40 bp) was assessed by electrophoretic mobility shift assay analysis. Where indicated, anti‐STAT1 antibodies were added to characterize the IFN‐γ‐inducible retarded complex denoted CI. FP, free probe; CII, supershifted complex. One representative of six independently performed experiments is shown. Right panel: protein binding to wild‐type oligonucleotides was compared with binding to the mutated oligonucleotides GASprox‐5′mut and GASprox‐3′mut, respectively. One representative of three independently performed experiments is shown. (D) DLD‐1 cells were kept as unstimulated control or stimulated with IFN‐γ (10 ng/ml). After 1 hr, cells were harvested followed by ChIP analyses as described in the ‘Materials and methods’ section. One representative of six independently performed experiments is shown (left panel). Right panel: sheared chromatin of the experiment shown in the left panel.
