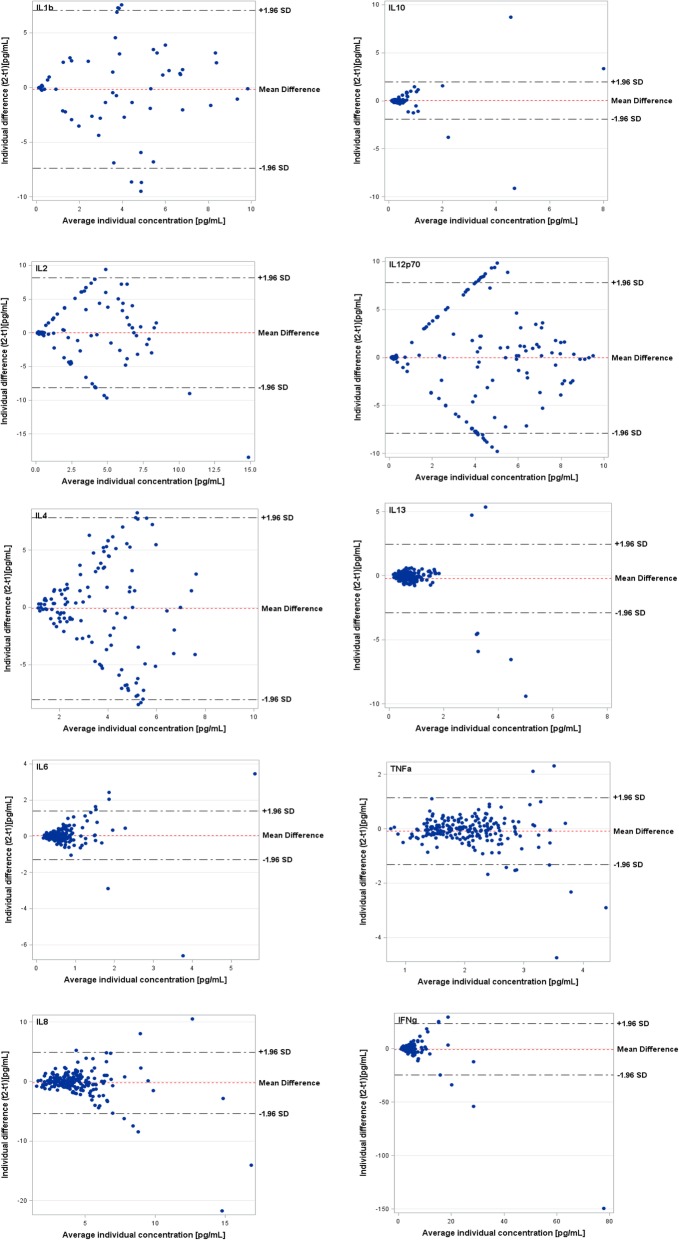
Fig. 1.
Bland-Altman plots showing the agreement between log-transformed cytokine concentrations at baseline and 4-months later in relation to average concentrations for each individual. Agreement of repeated measurements (y-axis) in relation to average concentrations (x-axis) for each individual. Horizontal lines show the mean difference and the 95% CI of limits of agreement, which are defined as the mean difference +/− 1.96 times the standard deviation of the differences

