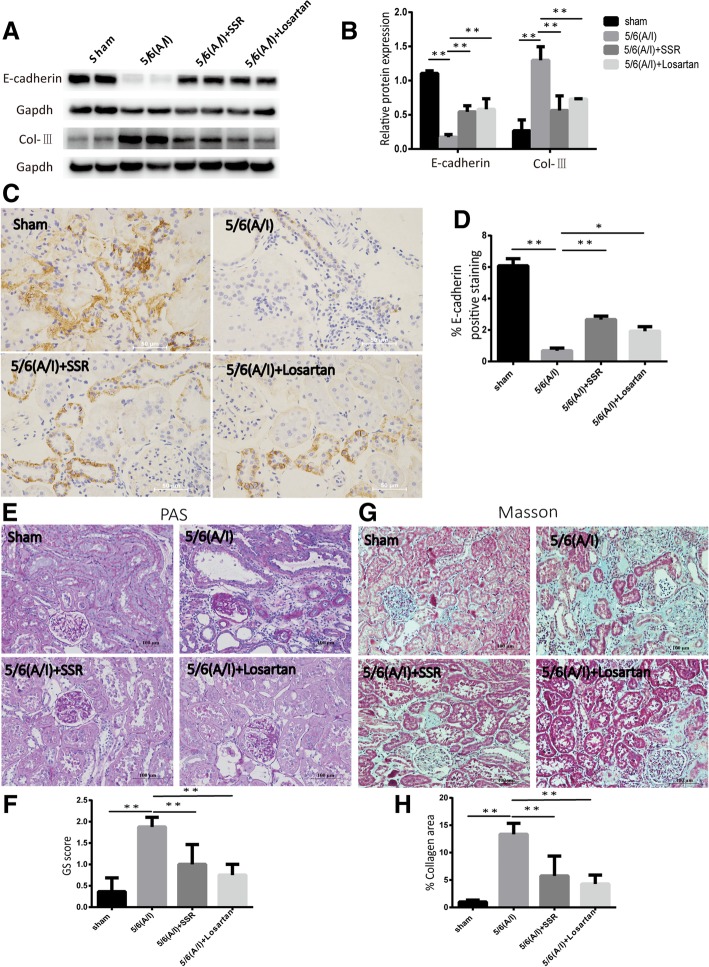
Fig. 1.
SSR attenuated renal injury and fibrosis in 5/6(A/I) model. (a) Immunoblot analysis of E-cadherin and Col-IIIexpression. (b) Western blot quantification of E-cadherin and Col-III levels.(n = 6) (c) Representative images of E-cadherin expression detected by IHC. 400 × magnification. (d) Quantitative analysis of E-cadherin positive area(n = 4) (e) Representative photomicrographs of PAS staining. 200 × magnification. (f) The severity of glomerular injury was assessed using the glomerulosclerosis (GS) score (g) Assessment of interstitial fibrosis by Masson’s trichrome staining.200 × magnification. (h) Semiquantitative result of collagen area(n = 4). Values are mean ± SD. *P < 0.05, **P < 0.01

