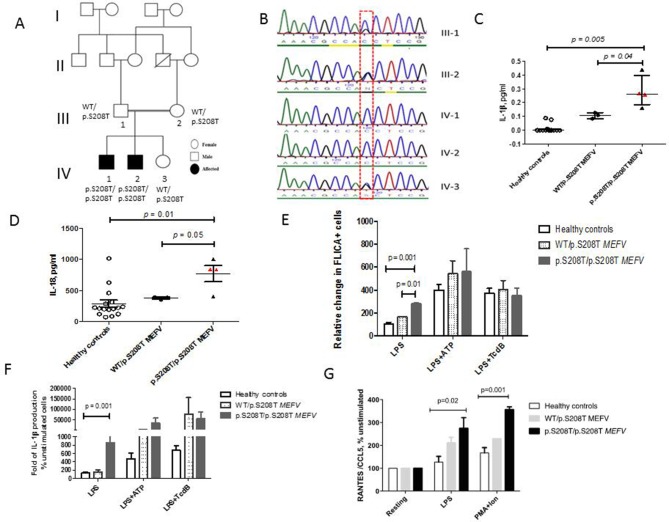
Figure 1.
Family tree, genetic sequencing results, proinflammatory cytokines and pyrin inflammasome activation in patients with homozygous p.S208T MEFV mutation. (A) The family tree shows the two affected male siblings and their unaffected sibling from the consanguineous marriage of first cousins; segregation of the p.S208T MEFV variant is also shown. (B) Sanger sequencing chromatogram of MEFV gene aligned to reference sequence exon 2 of MEFV. Line indicates a homozygous mutation of MEFV at position c.623 (red dashed box) present in both affected patients (IV-1 and IV-2) and heterozygous in parents (III-1 and III-2) and unaffected sister (IV-3). (C) Serum levels of interleukin (IL)-1β were elevated in IV-1 and IV-2 (median 0.26 pg/mL, range 0.16–0.44 pg/mL) compared with healthy controls (median 0 pg/mL, range of 0–0.08 pg/mL, p=0.005) and compared with their unaffected parents (III-2 and III-3), unaffected sibling (IV-3) all with WT/p.S208T MEFV genotype (median levels of 0.1 pg/mL, range of 0.08–0.12 pg/mL, p=0.04). (D) Similar differences were observed for total IL-18 levels that were elevated in IV-1 and IV-2 compared with controls, p=0.01 and compared with III-1, III-2 and IV-3, p=0.05. (E) Monocytes from IV-1 and IV-2 constitutively expressed higher levels of FLICA (caspase-1) in response to lipopolysaccharide (LPS) (mean 398, SEM 84.63) compared with controls (mean 292.8, SEM 95.49, p=0.001) and when compared with heterozygotes for p.S208T MEFV mutation (mean 371.5, SEM 109.7, p=0.01). (F) There was an increased release of IL-1β in monocyte supernatants derived from IV-1 and IV-2 following LPS stimulation compared with healthy controls (p=0.001). No significant difference in IL-1β secretion was observed between healthy and patient monocytes after ATP and TcdB addition. (G) There was enhanced release of CCL5 in patient derived peripheral blood mononuclear cells (PBMC) stimulated with LPS (mean relative CCL-5 levels at 233, SEM 37.29 pg/mL) compared with controls (mean relative CCL-5 levels of 126.6, SEM 24.91 pg/mL, p=0.02). Similar differences were observed between groups in CCL-5 release in response to PMA/Ionomycin stimulation, p=0.001. Error bars represent medians and range or for in vitro experiments means+SEM for three biological replicates. P values by Student’s t-test or Mann-Whitney U test <0.05 were considered significant. CCL-5, C-C-motif chemokine ligand 5; FLICA, fluorochrome inhibitor of caspases; PMA, phorbol 12-myristate13-acetate.

