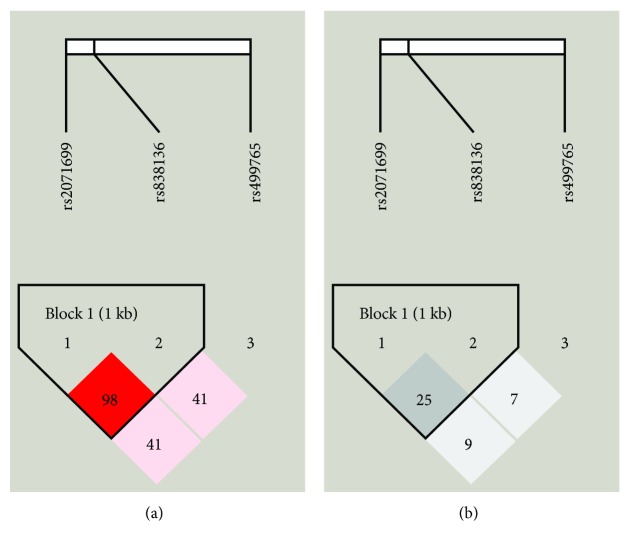
Figure 1.
Linkage disequilibrium analyses for SNPs tested in the FGF21 gene region. (a) Shades of pink indicate the strength of pairwise linkage disequilibrium based on |D′|, and numbers represent |D′| which is expressed as a percentage. (b) Shades of grey indicate the strength of pairwise linkage disequilibrium based on r2, and numbers represent r2 which is expressed as a percentage.

