Fig. 2.
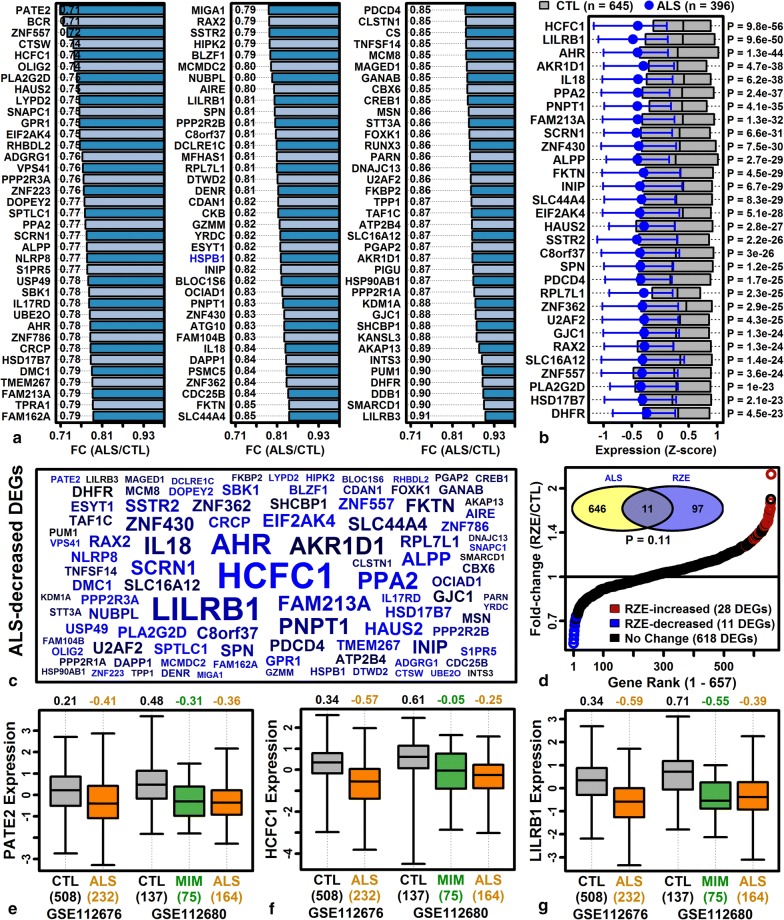
Top-ranked ALS-decreased DEGs. a Top ALS-decreased DEGs ranked by FC (blue font: ALS-associated genes). b Top ALS-decreased DEGs ranked by p-value. Z-score normalized expression values were combined across cohorts. Grey boxes outline the middle 50% of CTL expression values (midpoint: median), and magenta error bars outline the middle 50% of ALS expression values (circle: median). c ALS-decreased DEG symbol cloud. Gene symbol size is inversely proportional to differential expression analysis p-values (ALS vs. CTL) and colors are proportional to FC estimates (black: higher FC, blue: lower FC). d Riluzole (RZE) effects on ALS-decreased DEGs (GSE96653, MDA-MB-231 cells). FC estimates are plotted for 657 ALS-decreased DEGs (red symbols: RZE-increased, FDR < 0.10, FC > 1.10; blue symbols: RZE-decreased: FDR < 0.10, FC < 0.91). The Venn diagram (top-left) shows the overlap between ALS-decreased and RZE-decreased DEGs (p-value: Fisher’s exact test). e Prostate and testis expressed 2 (PATE2) expression. f Host cell factor C1 (HCFC1) expression. g Leukocyte immunoglobulin like receptor B1 (LILRB1) expression. In e–g, Z-score normalized expression values are shown for each cohort (boxes: middle 50% of values; whiskers: 10th to 90th percentiles) with sample sizes in each group (bottom margin, parentheses)

