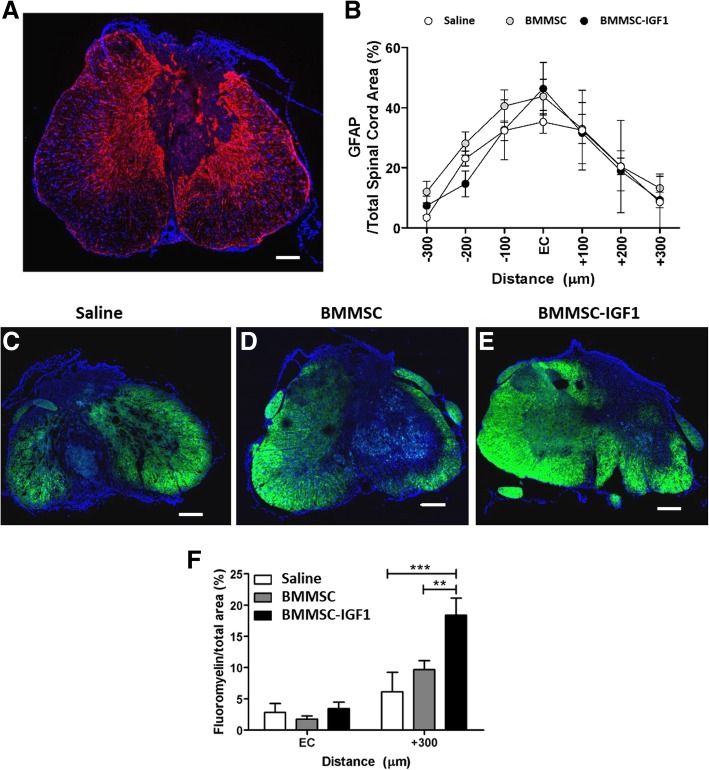
Fig. 6.
Lesion volume and myelination 4 weeks following SCI and treatment. Lesion volume (a) as measured by GFAP staining, which is concentrated around the lesion site, measured against total spinal cord area bilaterally from the epicenter (EC) of the injury. b Quantification of GFAP derived lesion volume. Myelination immunostaining with fluoromyelin was performed in saline (c), BMMSC (d), and BMMSC-IGF1 (e) treated SCI sections. Quantitative analysis (f) of fluoromyelin-labeled oligodendrocytes at the EC and 300 μm caudally. Bars represent means ± SEM of five mice/group. Values represent mean ± SEM. *P < 0.05 (BMMSC-IGF1: EC vs + 300), #P < 0.05 (+ 300: BMMSC-IGF1 vs BMMSC)

