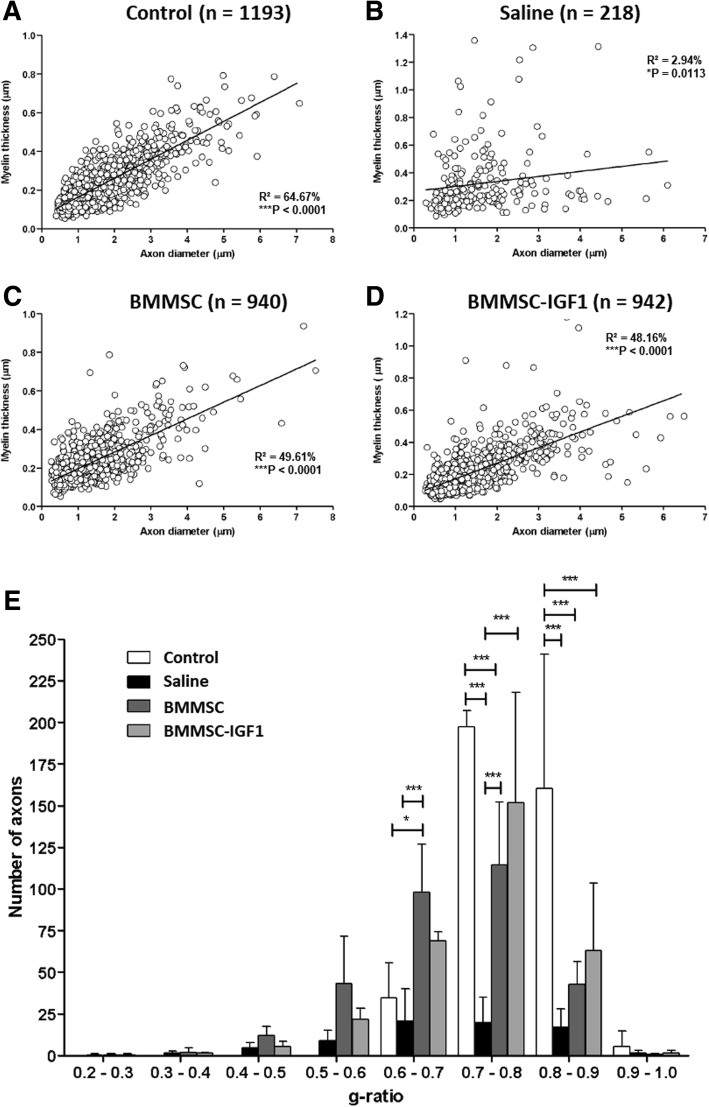
Fig. 8.
Quantitative ultrastructural analyses of spinal cord sections in uninjured and SCI mice. a-d Linear regression analysis between myelin thickness and axon diameter from control, saline, BMMSC, and BMMSC-IGF1 groups. Three animals were used in each group. e Axon distribution by g-ratio range in control (N = 1193), saline (N = 218), BMMSC (940), and BMMSC-IGF1 (942) groups. Analysis was done as described in the “Materials and methods” section. Values represent the mean ± SEM in each range. *P < 0.05; ***P < 0.001

