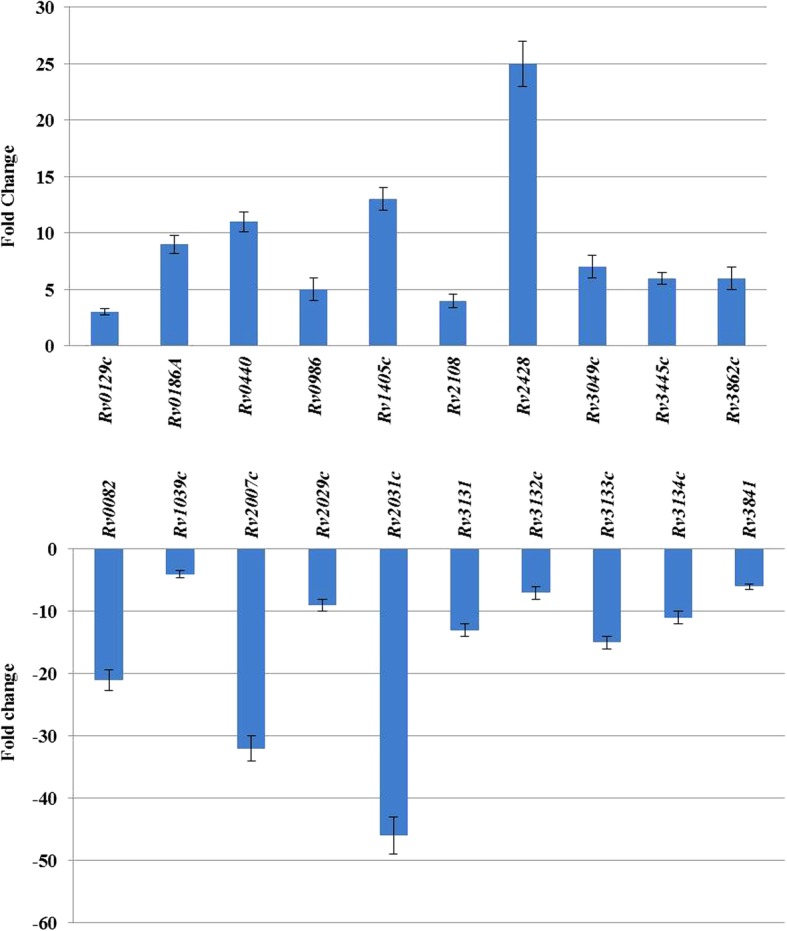
Fig. 3.

The relative expression of selected genes. The relative expression levels of selected genes in the presence and absence of 8 mM VB1 by qRT-PCR analysis. Standard deviations (calculated for three biological replicates) are indicated. X-axis represents the identities of tested genes; Y-axis represents the fold-changes of tested genes in both VB1 treatment and control groups. a The fold-changes of upregulated genes following VB1 treatment. The genes listed on the X-axis are JTY_RS00695 (Rv0129c), JTY_RS01000 (Rv0186A), JTY_RS02300 (Rv0440), JTY_RS05235 (Rv0986), JTY_RS07460 (Rv1405c), JTY_RS10910 (Rv2108), JTY_RS12600 (Rv2428), JTY_RS15805 (Rv3049c), JTY_RS18025 (Rv3445c) and JTY_RS20155 (Rv3862c). b The fold-changes of downregulated genes following VB1 treatment. The genes listed on the X-axis are JTY_RS00455 (Rv0082), JTY_RS05530 (Rv1039c), JTY_RS10385 (Rv2007c), JTY_RS10510 (Rv2029c), JTY_RS10520 (Rv2031c), JTY_RS16215 (Rv3131), JTY_RS16220 (Rv3132c), JTY_RS16225 (Rv3133c), JTY_RS16230 (Rv3134c) and JTY_RS20045 (Rv3841)
