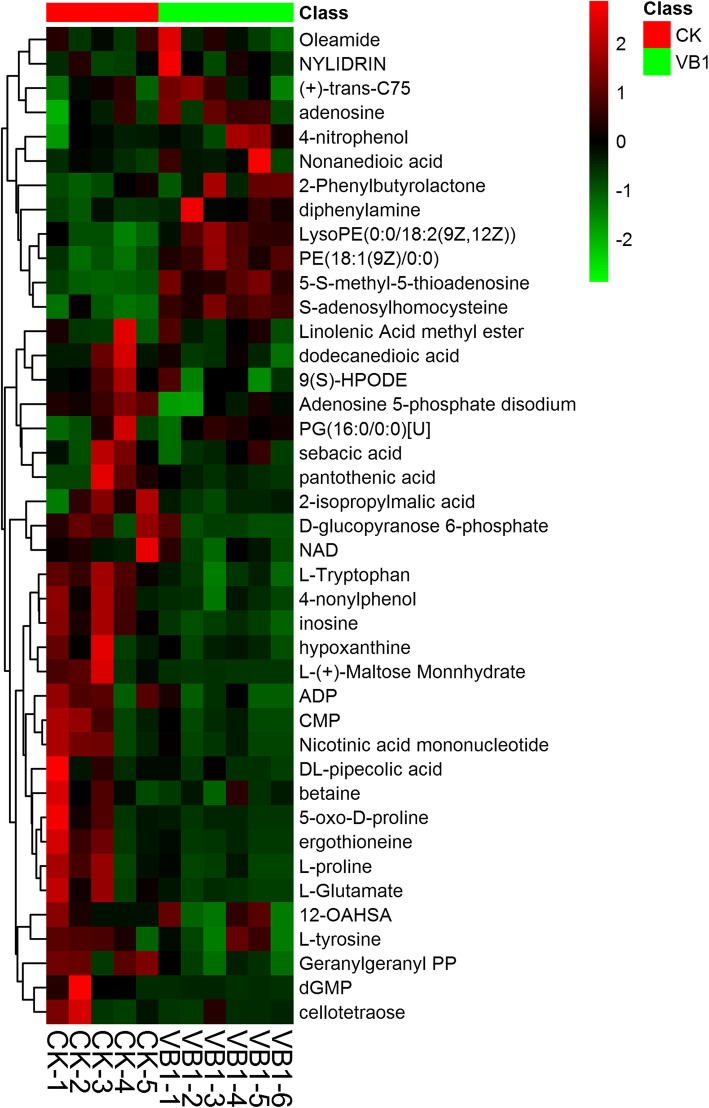
Fig. 4.
The heatmap analysis of different metabolites in VB1 treatment and control groups. The red and blue colors indicate metabolites with increased and decreased levels, respectively. The rows represent control samples (CK-1, CK-2, CK-3, CK-4 and CK-5) and experimental samples treated with VB1 (VB1–1, VB1–2, VB1–3, VB1–4, VB1–5 and VB1–6). The identities of metabolites are listed on the right side of the heatmap

