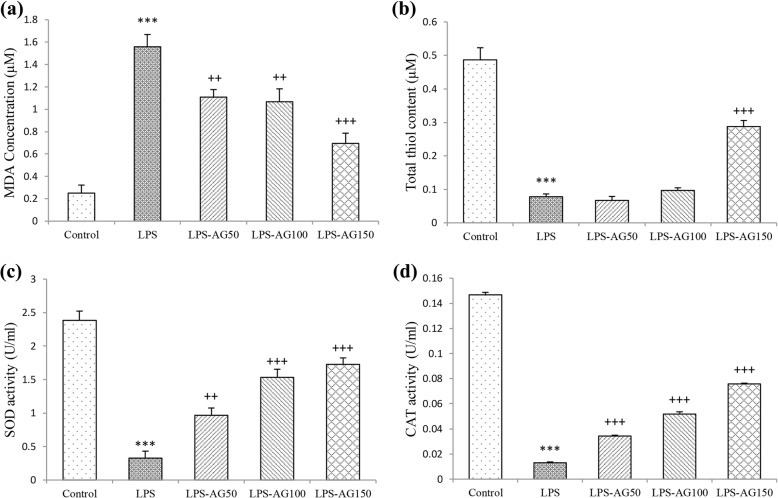
Fig. 5.
MDA concentration (a), thiol content (b), SOD (c) and CAT activities (d) in BALF. Data are shown as mean ± SEM (n = 10 per group). ***;P < 0.001 compared to control group, ++;P < 0.01 and +++;P < 0.001 compared to LPS group. Statistical analysis were performed using one-way analysis of variance (ANOVA) followed by Tukey’s multiple comparison test

