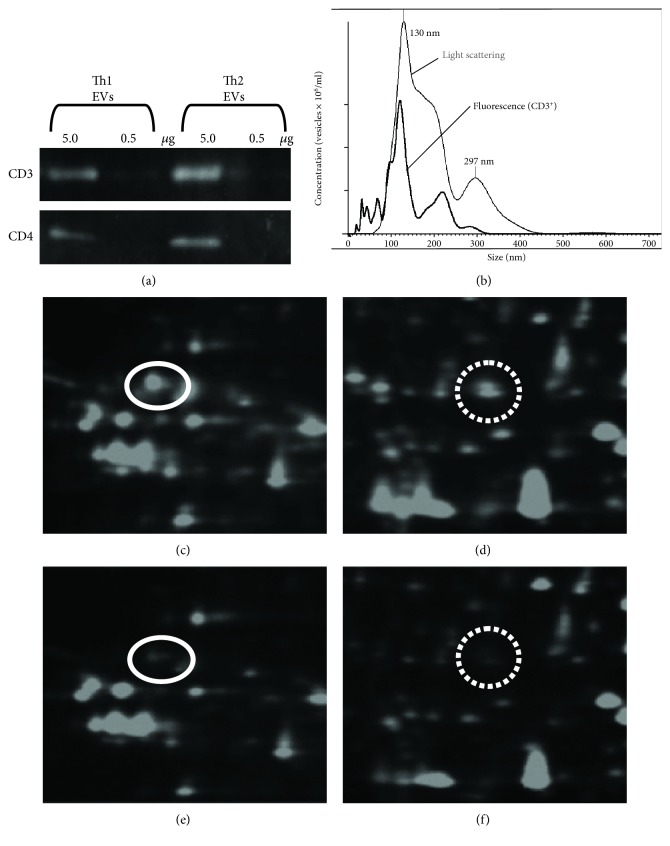
Figure 1.
Identification of Th1-derived EV-dominant proteins. (a) Chemiluminescence images. Th1- and Th2-derived EVs were subjected to western blot analysis with anti-CD3 and anti-CD4 mAbs. (b) Fluorescent nanoparticle tracking image. Th1-derived EVs were stained with Qdot655-conjugated anti-CD3 antibody and analyzed on the NanoSight. Results in light scatter (black line) and fluorescence (grey line) modes. (c, d) Two parts of 2D-DIGE images of Th1-derived EV proteins. (e, f) 2D-DIGE images of Th2-derived EV proteins in the same areas as c and d, respectively. Protein spots that showed differences in the fluorescence intensities were picked up for MS analysis. The protein spots indicated by circles (panels c and e, mw = 37067 and pI = 4.8) and dotted circles (panels d and f, mw = 31322 and pI = 7.8) were identified as alpha- and beta-chains of HLA-DR, respectively. Data from one out of six pairs of EVs are shown. The results were similar for the five out of six pairs.

