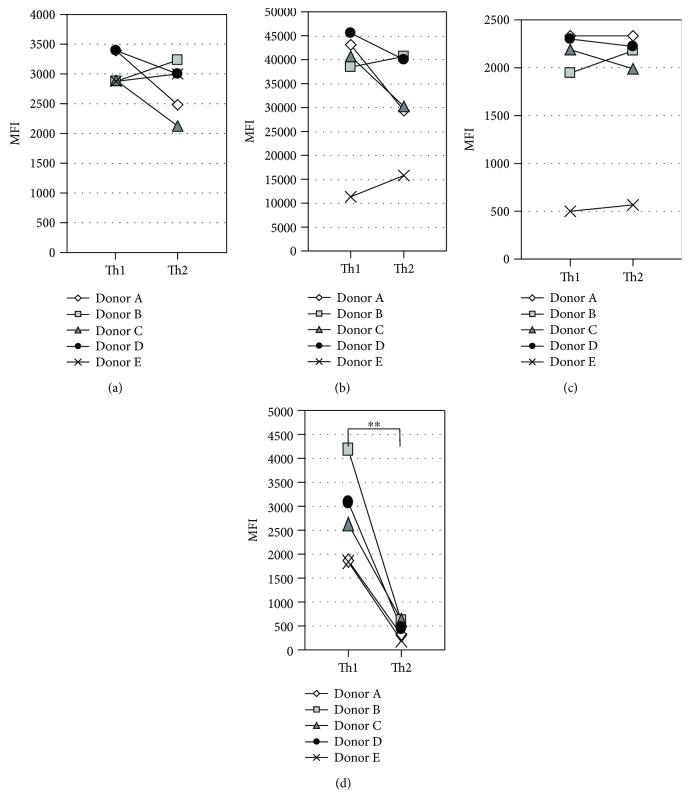
Figure 2.
Comparison of various marker proteins between Th1 and Th2 cells. Five pairs of established Th1 and Th2 cells were restimulated with mAbs to CD3 and CD28 under Th1- and Th2-inducing conditions, respectively. After three-day culture, the expression levels of CD3 (a), CD4 (b), CD63 (c), and HLA-DR (d) on the cell surface were measured by FCM. ∗∗P < 0.01, by the Mann–Whitney U test between Th1 and Th2.

