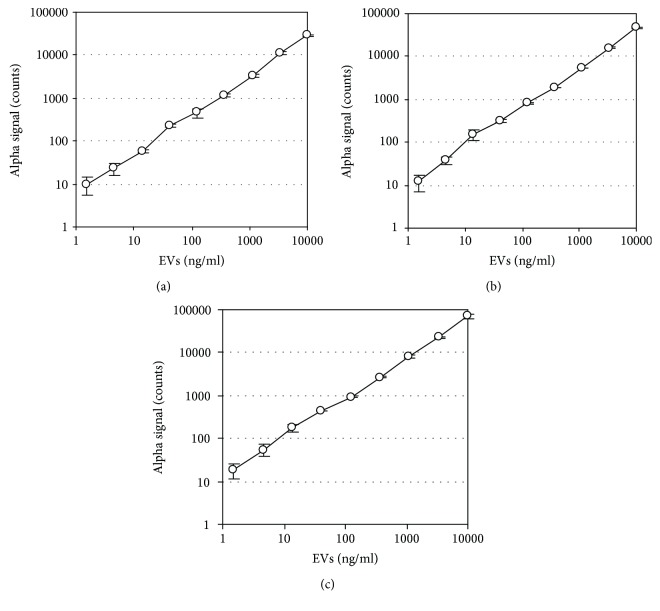
Figure 3.
Correlation between concentrations of EVs and AlphaLISA signals. Purified EVs derived from CD4+ T cells (a), CD8+ T cells (b), and Th1 (c) were subjected to AlphaLISA assay for CD3+CD4+ EVs, CD3+CD8+ EVs, and CD3+HLA-DR+ EVs, respectively. Protein concentrations of EVs were determined with the bicinchoninic acid assay. The correlation coefficient (r) between data sets of CD3+CD4+ EVs, CD3+CD8+ EVs, and CD3+HLA-DR+ EVs were 1.000, 0.999, and 0.999, respectively.

