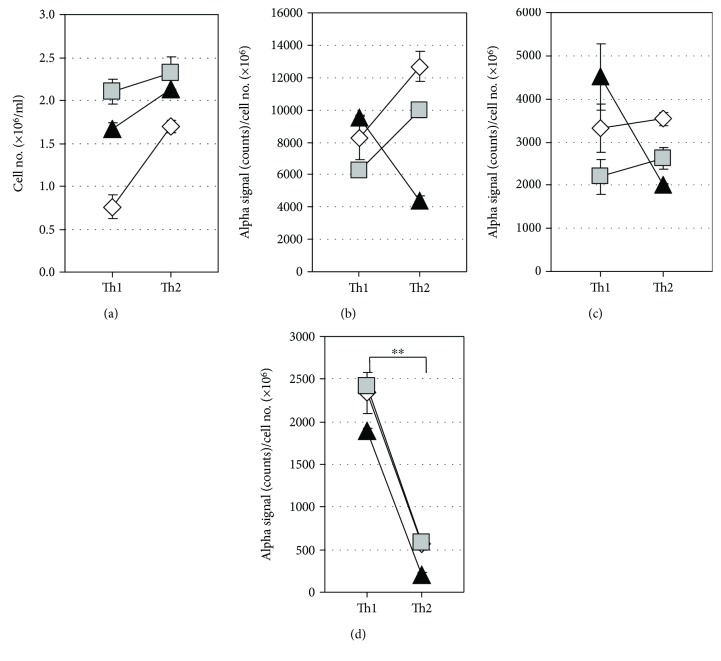
Figure 4.
Comparison of T cell-derived EVs between Th1 and Th2 cultures. Three pairs of established Th1 and Th2 cells were restimulated with CD3 and CD28 antibodies under Th1- and Th2-inducing conditions with a starting cell density of 1.0 × 10⁶ cells/ml. After 5-day culture, the cell density was determined by the trypan blue dye-exclusion test (a) and levels of CD3+CD4+ EVs (b), CD3+CD63+ EVs (c), and CD3+HLA-DR+ EVs (d) in the culture supernatants were measured by AlphaLISA. AlphaLISA counts were normalized by dividing the value by the cell number. Data are presented as the mean ± SD. ∗∗P < 0.01, by the Mann–Whitney U test between Th1 and Th2.

