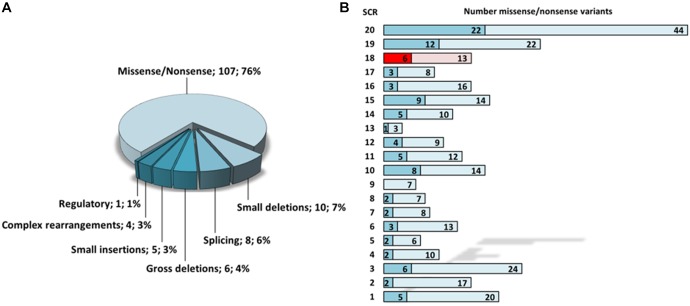
FIGURE 4.
Statistical evaluation of aHUS-associated CFH variants according to HGMD 2018.4. (A) Frequency of aHUS-associated variant subtypes. (B) Mapping of total (light colors) and aHUS-associated (dark colors) missense/non-sense variants onto distinct SCR domains of CFH. SCR 18 is highlighted in red. SCR, short consensus repeat.

