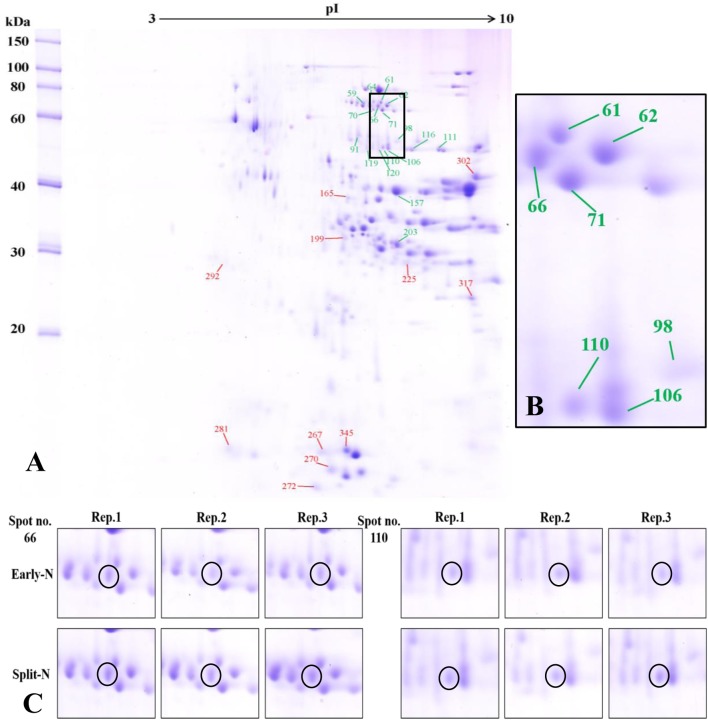
FIGURE 2.
(A) Effect of split N application on grain proteome in JB Asano. The green and red lines with numbers indicate the spots that were significantly increased or decreased by split N application, respectively. pI, isoelectric point. (B) Section part of the panel (A) with protein spots that were increased with split N application. (C) Detailed images of protein spots whose abundances were increased by more than 0.5-fold with/without split N application from raw images of three biological replicates, respectively.

