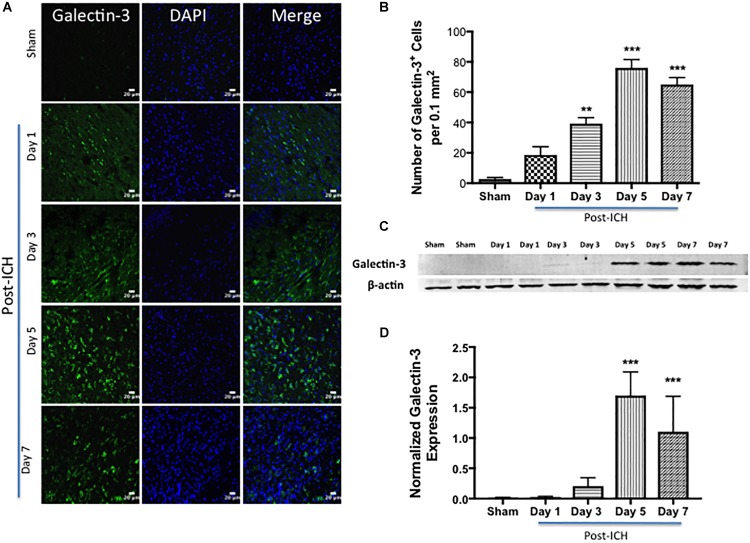
FIGURE 2.
Augmented expression of Galectin-3 after ICH. (A) Temporal expression pattern of Galectin-3 in the perihematomal area after ICH. The representative confocal images show a remarkable increase in Galectin-3 expression after ICH in comparison to Sham (scale bar = 20 μm; n = 3–5 per group). (B) The average number of Galectin-3 positive cells per 0.1 mm2 in the ipsilateral striatum. (C) Temporal expression of Galectin-3 was further confirmed using western blotting. (D) Densitometry analysis (n = 3–5 per group) of the western blotting data. ∗∗p < 0.01, ∗∗∗p < 0.001 vs. sham.

