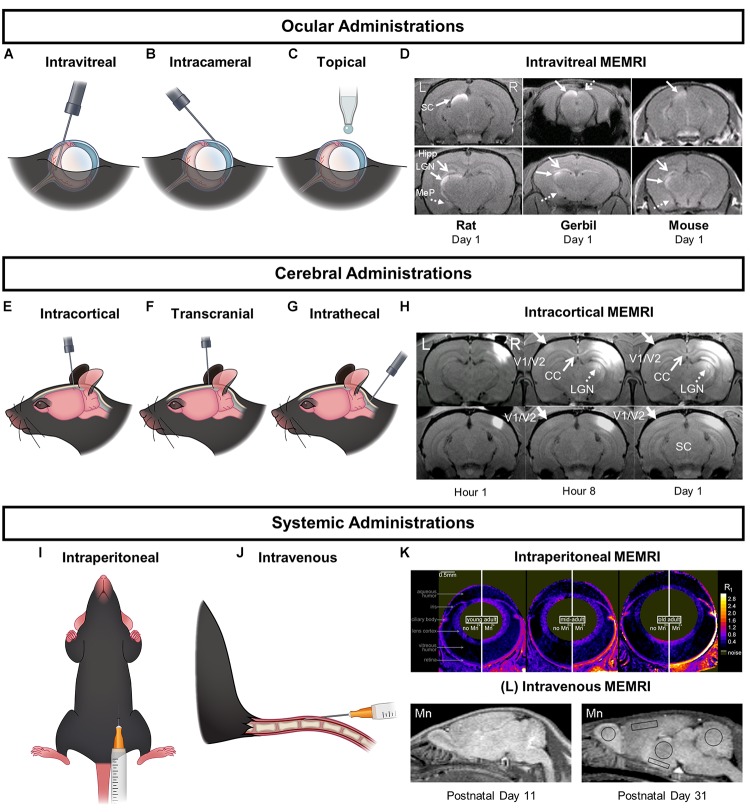
FIGURE 2.
Major Mn2+ delivery routes and the corresponding MEMRI enhancement patterns in the visual system. (A–C,E–G,I,J) are schematic representations of ocular, cerebral, and systemic injection routes respectively. (D,H,K) are the corresponding MEMRI enhancement patterns in the brain as a result of the specific Mn2+ administrations. (D) is a series of MEMRI scans of the rat, gerbil, and mouse brains 1 day after an intravitreal Mn2+ injection. Mn2+ enhancement could be found in the contralateral SC and LGN along the central visual pathway, and in the non-visual regions in the contralateral hippocampus (Hipp) and medial posterior amygdala (MeP). (H) contains MEMRI scans of a rat brain after intracortical Mn2+ injection to the right V1/V2 transition zone at 1-, 8-, and 24-h time points. Mn2+ enhancement could be observed along the cortico-cortical pathways in the left contralateral V1/V2 border and the splenium of corpus callosum. Mn2+ was also seen to transport along the cortico-subcortical feedback pathways in the ipsilateral LGN and SC. MEMRI scans in (K) portray age-related increase in outer retinal Mn2+ uptake in Long Evans rats between 2.4 and 19 months old. MEMRI was taken at baseline and at about 4 h after intraperitoneal Mn2+ administration using quantitative mapping of tissue R1 values in units of s-1. (L) shows sagittal MEMRI scans of postnatal days (PD) 11 and 31 rats at 24 h after intravenous Mn2+ injection. Brain Mn2+ uptake appeared higher in neonates and decreased with brain development. An estimate of the relative cortical concentration of manganese uptake shows a twofold drop from PD 11 to PD 31. (D,H,K,L) are reproduced with permissions from de Sousa et al. (2007), Bissig et al. (2013), and Chan et al. (2014a, 2017).

