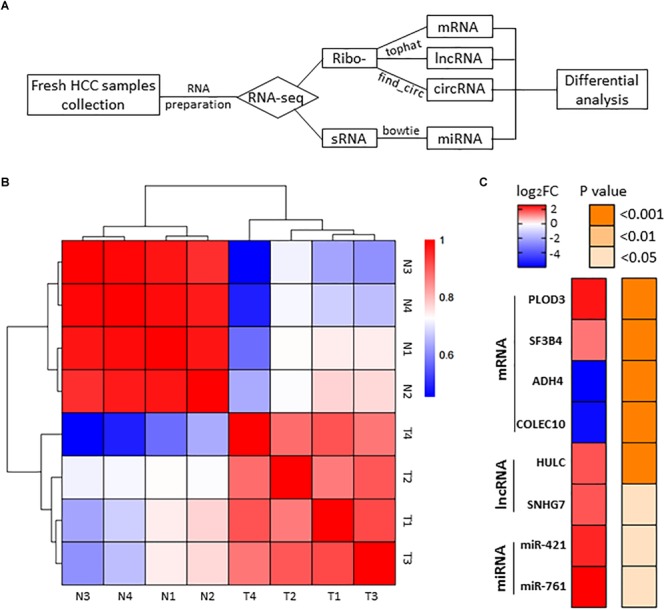
FIGURE 1.

RNA-seq analysis of HCC samples. (A) The workflow of RNA-seq. (B) Heatmap of correlation between each sample by Pearson’s correlation coefficient analyses. (C) Eight RNA samples as positive controls are validated in the RNA-seq. Red, upregulated; blue, downregulated. Fold change ≥2.0, P < 0.05.
