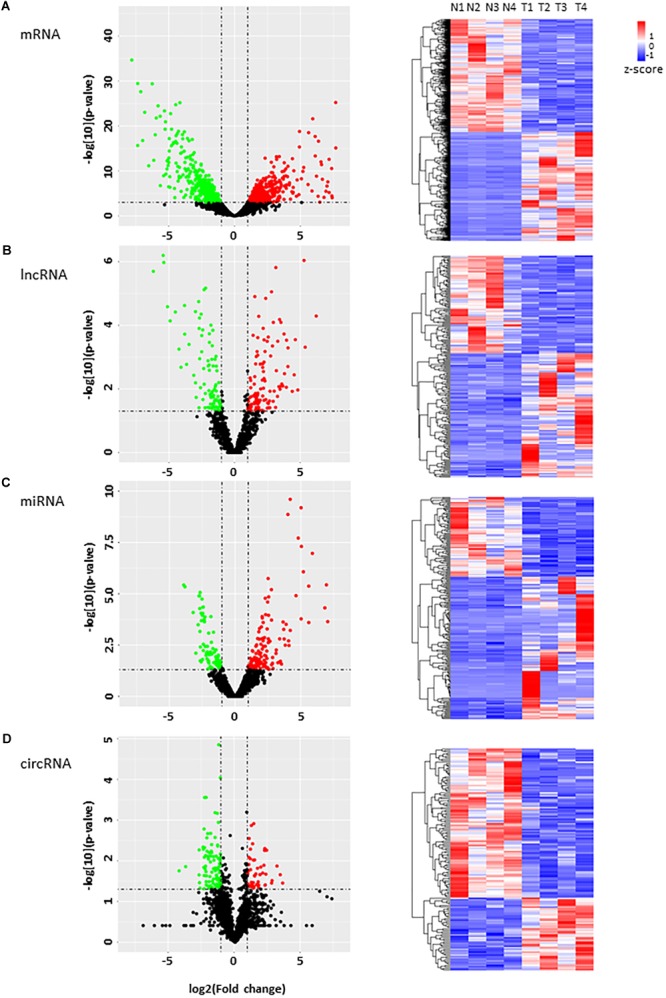
FIGURE 2.

Analysis of the RNA expression profile in HCC. (A–D) volcano plots (left) display differentially expressed transcripts, and the hierarchical cluster analyses on the right of each panel display differential expression of RNAs in four HCC tumor tissues and their controls. (A) mRNAs, (B) lncRNAs, (C) miRNAs, and (D) circRNA. Green and red dots represent downregulated and upregulated RNAs respectively in tumor tissues compared with adjacent tissues. Black dots indicate no significant difference.
