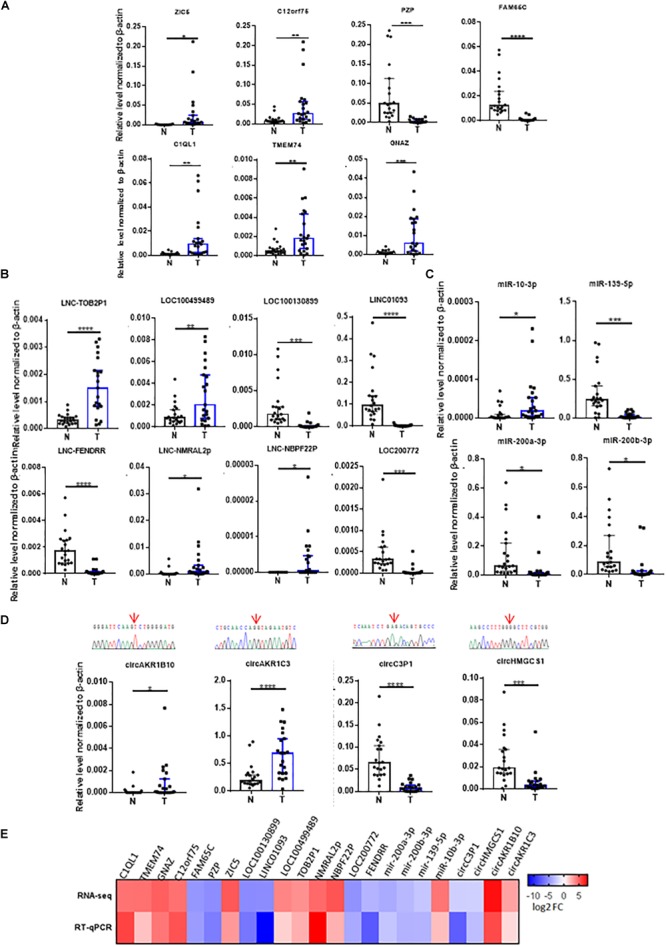
FIGURE 3.

Validation of RNAs identified from RNA-seq in 21 HCC tumor tissues by RT-qPCR. The validation results of (A) 7 dysregulated mRNAs, (B) 8 dysregulated lncRNAs, (C) 4 dysregulated microRNAs, and (D) 4 dysregulated circRNAs, red arrows above indicate junctions of circRNAs from the sequencing results. (E) The heatmap for the comparison of the RT-qPCR and RNA-seq. N, adjacent non-tumor tissues. T, tumor tissues. Data are median ± SD. ∗p < 0.05, ∗∗p < 0.01, ∗∗∗p < 0.001, ∗∗∗∗p < 0.0001 are based on the Student’s t-test.
