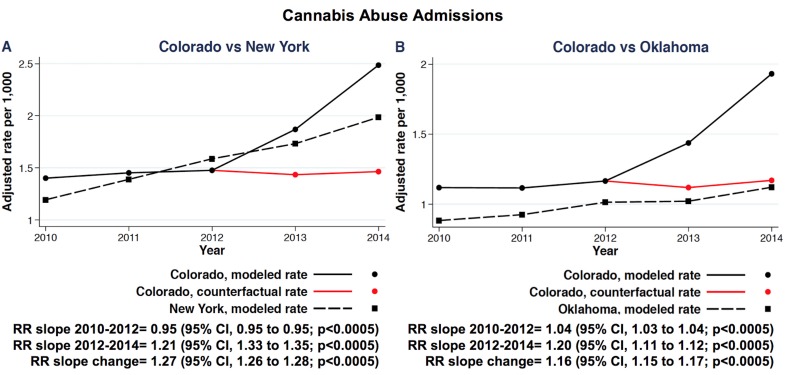
Figure 1.
Multivariate adjusted rates of admissions for cannabis abuse over 2010 to 2014 in Colorado, site of implementation of the 2012 recreational cannabis legalisation policy, compared with New York (A) and Oklahoma (B), control states without cannabis legalisation. Red lines show the predicted rates of admissions for cannabis abuse had the cannabis legalisation policy not been instituted. The comparison between Colorado and the control states with regards to change of RR slope within the 2010 to 2012 period (pre-legalisation) and 2012 to 2014 period (post-legalisation), as well of the overall RR slope change, are also represented for the Colorado versus New York (A) and Colorado versus Oklahoma (B) comparisons. Red lines show the predicted rates of admissions for cannabis abuse had the cannabis legalisation policy not been instituted. Each model was adjusted for age, gender and race and state-level characteristics (see methods section for further details). RR, risk ratio; vs, versus.

