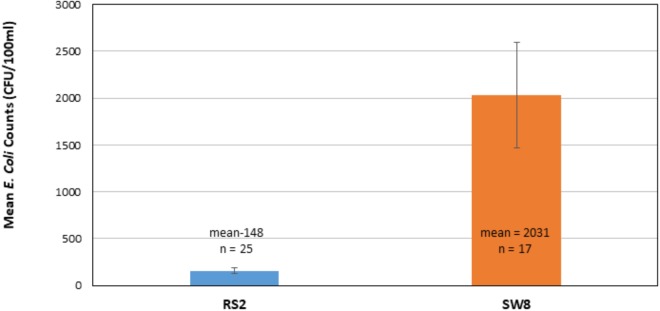
FIGURE 2.
Comparison of mean E. coli counts in runoff as it enters (RS2) and leaves the wetland roost zone (SW8). The mean of counts in CFUs, determined 25 times between 2014–2017 at RS2 and 17 times at SW8, is shown. Triplicate samples were collected at each site each time. The error bars represent one standard deviation around the mean for the respective data sets.

