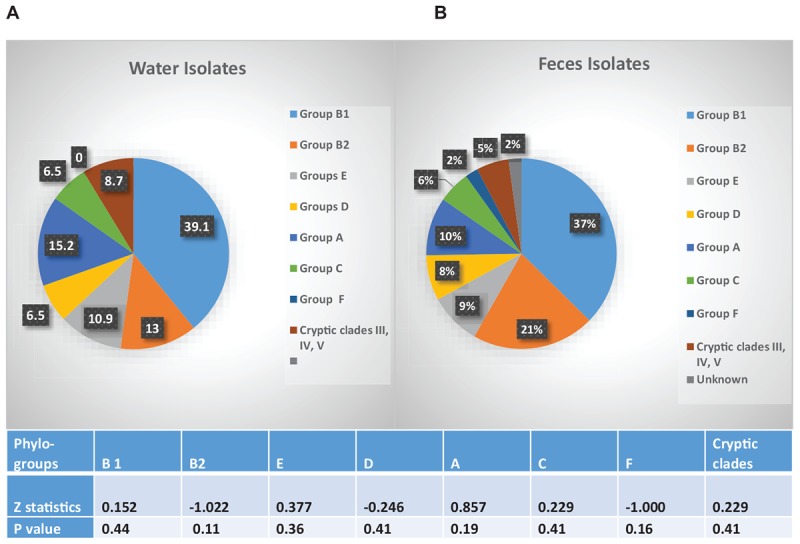
FIGURE 5.

Phylo-grouping of the Isolates. Percentage of E. coli isolates from water (n = 46) and feces (n = 92) belonging to each phylo-group. Different groups are represented by different colors. Among the water isolates there were no unknowns. Table indicates significant difference in presence of each phylo-group, between water and fecal samples.
