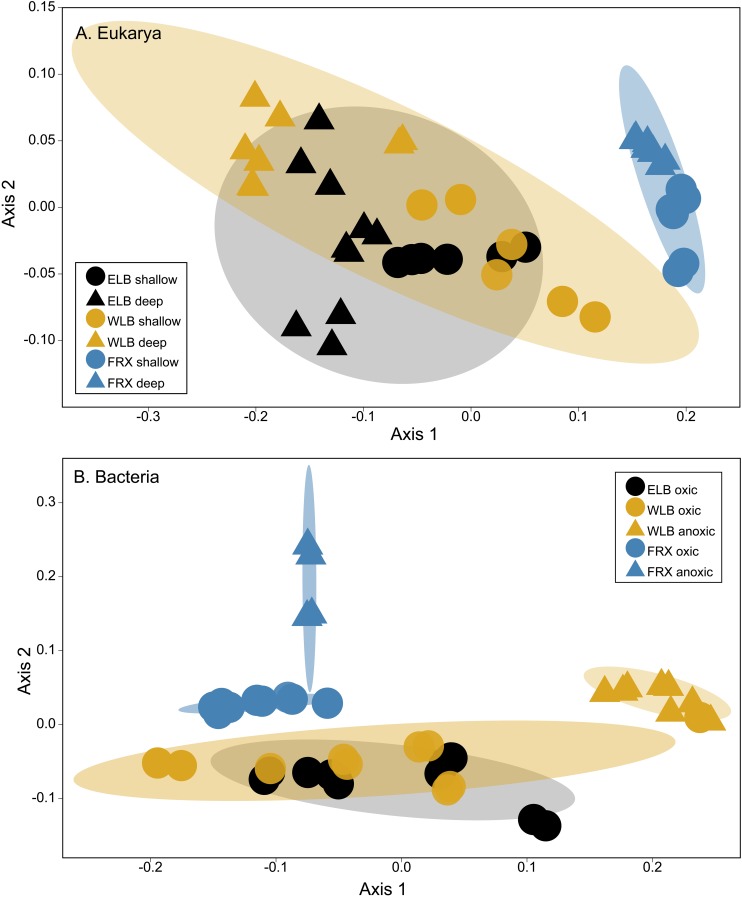
FIGURE 4.
(A) A non-metric multidimensional scaling (NMDS) plot of eukaryotic communities (OTU counts, Bray-Curtis dissimilarity, stress = 0.077). Shaded areas indicate 90% similarity within each lake. Shallow: epilimnion. Deep: chemocline + hypolimnion. (B) A NMDS plot of bacterial communities (OTU counts, Bray-Curtis dissimilarity, stress = 0.072). Oxic and anoxic: upper oxic zone and deep anoxic zone in the water columns, respectively. Shaded areas indicate 75% similarity within each lake.

