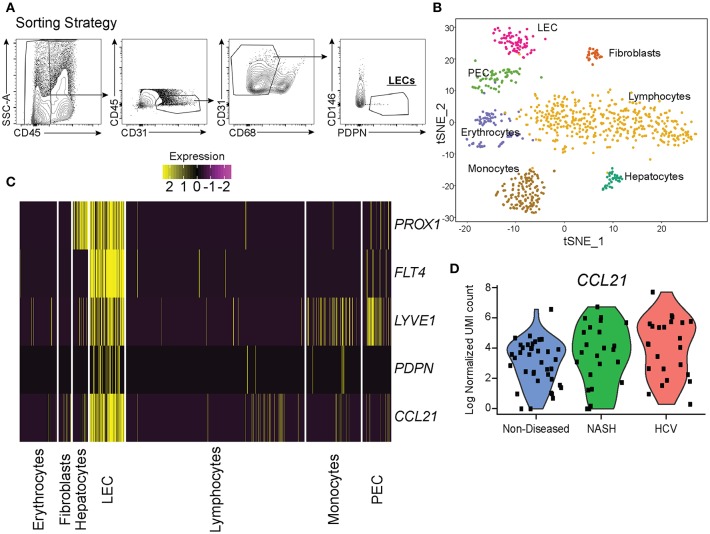
Figure 3.
Single cell analysis of liver lymphatic endothelial cells. (A) Sorting strategy used to identify LECs. (B) TSNE analysis from single cell mRNA sequencing of cells obtained from the sorting strategy in (A). (C) Expression of LEC specific genes expressed by isolated cell subsets from the liver (yellow = high, purple = low). (D) Normalized CCL21 mRNA expression by LECs from non-diseased (blue), NASH (green), or HCV (red) livers.

