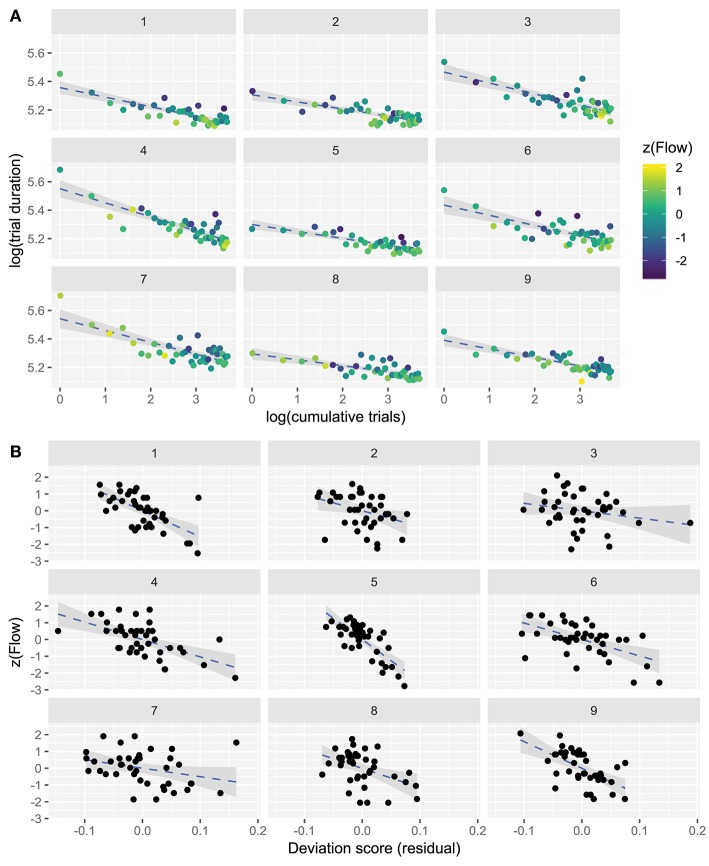
Figure 3.
(A) Participant-wise data showing logarithm-transformed performance and Flow self-reports in the speeded steering task. Ordinate shows log-duration of trials, abscissa shows log-cumulative trial count. Dashed blue lines fitted to the data are power-law learning curves, which transform to linear in log-log space. 95% confidence intervals around the slope are grayed. Flow scores (z-scored) are indicated by color. (B) Participant-wise deviation scores (observed trial duration minus predicted trial duration) plotted against Flow scores for each participant, and fitted by linear models. 95% confidence intervals around the slope are grayed.

