
Figure 4.
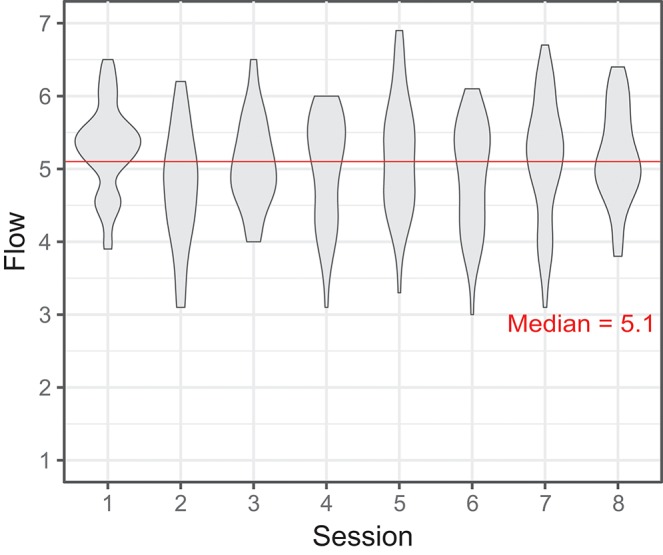
Violin plot representing participants' self-reported Flow in sessions 1–8 (per-session Flow = mean of five trials. The self-report items are given in Supplementary Information, the scale was 1–7).
Official websites use .gov
A
.gov website belongs to an official
government organization in the United States.
Secure .gov websites use HTTPS
A lock (
) or https:// means you've safely
connected to the .gov website. Share sensitive
information only on official, secure websites.
Violin plot representing participants' self-reported Flow in sessions 1–8 (per-session Flow = mean of five trials. The self-report items are given in Supplementary Information, the scale was 1–7).