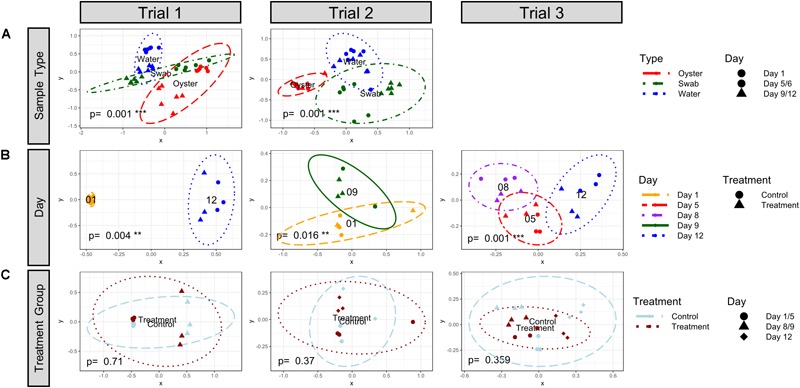
FIGURE 3.

NMDS plot visualization of Bray-Curtis beta-diversity (k = 2) at the Order level by (A) sample type, (B) sampling day, and (C) treatment. The ellipse lines show the 95% confidence interval (standard deviation). p-values indicate significance of grouping with adonis2 Permutational Multivariate Analysis of Variance Using Distance Matrices test. (A) The different types of samples are indicated by colors (Oyster, dashed red; Swab, dashdot green; and Water, dotted blue) and the days are indicated by symbols (Timepoint 1, circle; Timepoint 2, triangle). The water and oyster communities were significantly distinct from each other in both trials. (B) The sampling timepoints are indicated by colors (1, longdash yellow; 5, shortdash red; 8, dashdot purple; 9, solid green; and 12, dotted blue) and the treatment group is indicated by symbols (control, circle; probiotic treatment, triangle). The water community was significantly different between timepoints. (C) The treatment group is indicated by colors (control, light blue dashed; probiotic treatment, dark red dotted) and sampling timepoints are indicated by symbols. No significant differences in community structure in water from control and probiotic-treated tanks was detected when samples from all timepoints were analyzed together.
