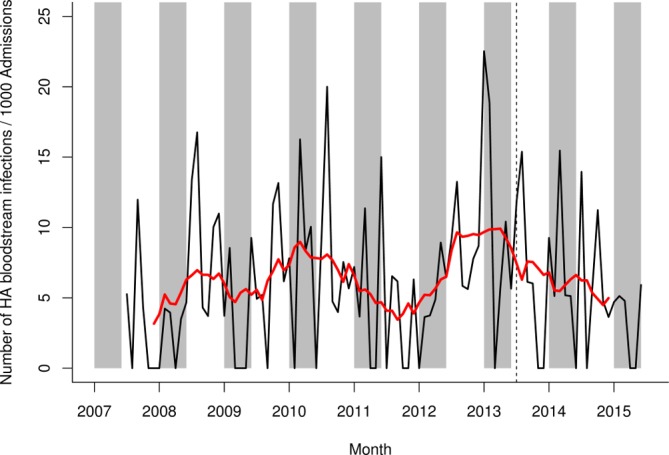
Figure 4.

HA bloodstream infection rate on general medical wards in Alder Hey NHS Foundation Trust, July 2007–June 2015. Black line shows raw data, red line shows smoothed data. Grey shading represents the rotavirus season (January–May). The vertical hashed line represents the introduction of rotavirus vaccine in the UK in July 2013. HA, hospital-acquired; NHS, National Health Service.
