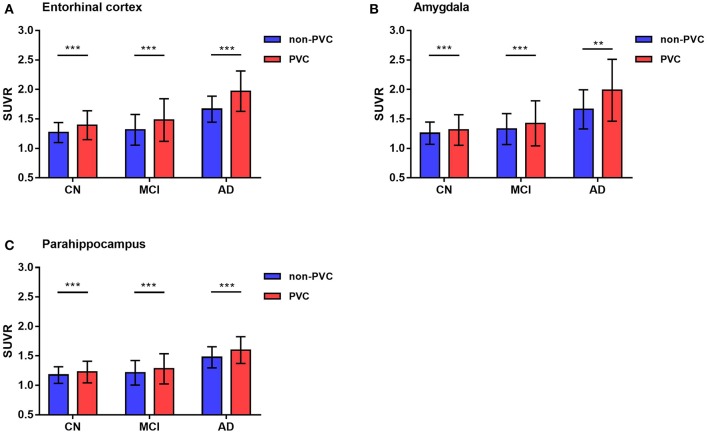
Figure 3.
Representative 18F-AV1451 SUVRs comparison with or without PVC. Bar graphs showing ROIs SUVR (mean with error bars depicting SD) comparison between PVC and non-PVC in entorhinal cortex (A), amygdala (B) and parahippocampus (C). P-value was defined using paired t-test to compare SUVR between PVC and non-PVC images in CN, MCI, and AD groups. **p < 0.01, ***p < 0.001.

