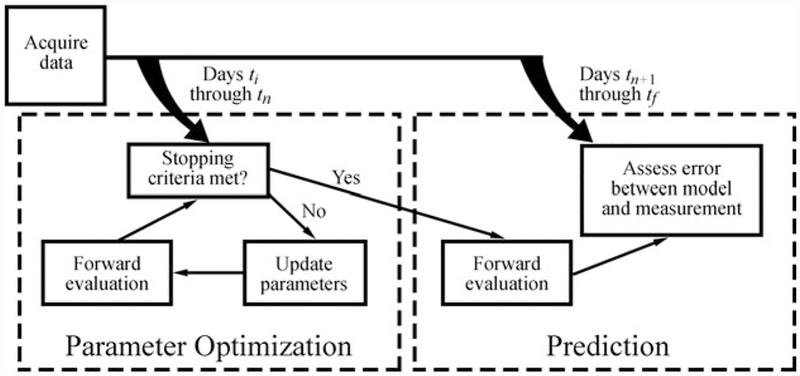
Fig. 2.
Tumor growth modeling and prediction flow chart. DW-MRI and CE-MRI data is first acquired in rats at days ti to tf. A subset of the total data (ti to tn is used to first estimate model parameters using an iterative optimization algorithm. The optimized model parameters are then used in a forward evaluation of the model system to predict tumor growth at the remaining data points (tn + 1 to tf). The error is then assessed between the model and measured values of N(x, y, z, t)

