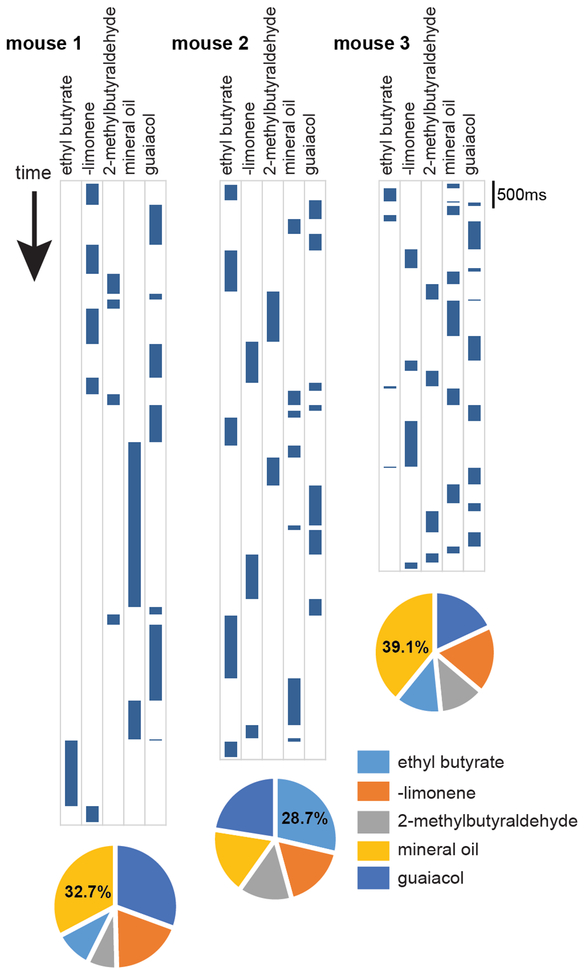
Figure 3. Example of diversity in odor-directed nose-poking behavior between mice.
Example poking strategies of 3 mice in one behavioral session. In this example, the odors were in the same spatial location for all 3 mice. Only the times the mice nose-poked are plotted as blue bars, with time refraining from poking not indicated. In these examples, one can appreciate the diversity across mice in their tendencies to sample odors. Below are pie charts representing the percentage of total time each mouse spent investigating (nose-poking) each odor. The percentage displayed indicates the maximum percentage of total time investigating a given odor.

