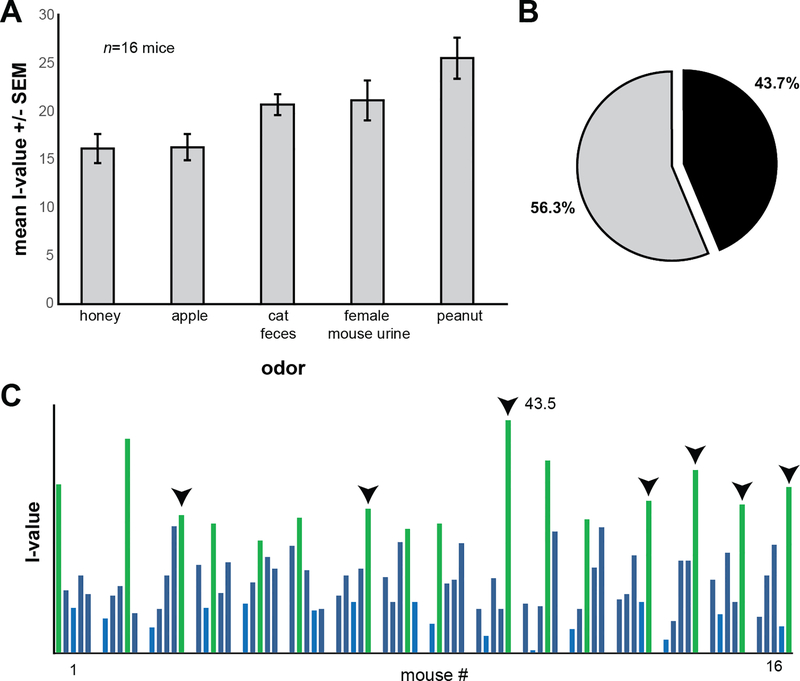
Figure 7. Population level ‘preferences’ for ethologically relevant odors are not observed at the individual mouse level.
(A) Histogram of mean I-values illustrating that as a population, mice display preferences towards some ethologically-relevant odors more so than others. The mean I-value across all mice and stimuli was 20.0 +/− 7.40 s.d.. Pie chart in (B) presents the % of mice which displayed their highest I-value towards peanut (black) compared to those which did not (gray). (C) Spark plot of each mouse’s I-value showing that at the individual animal level, animals display their highest I-value (green bars) towards a variety of non-ethologically relevant odors. Downward arrowheads indicate which mice displayed their highest I-value towards peanut, which according to the population-level data in (A) is the ‘preferred’ odor. Note that most mice did not contribute their highest I-value towards peanut.

